Historical Statistics
-
-
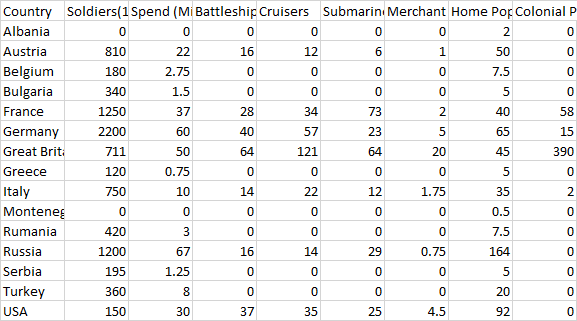
@Cernel Ellis just lists the 1939 values and specifically invites the readers to extrapolate from the sinking & building figures.
For Italy, I simply calculated Italy as a member of the Allies in 1944 & 1945.
Ellis puts Axis shipping losses in the Med 187,000 for 1940.
-
Thought this group would find this post interesting, see link below:
-
Here are some more detailed manpower statistics from Ellis. Note that Japan does not fare badly in terms of total numbers:
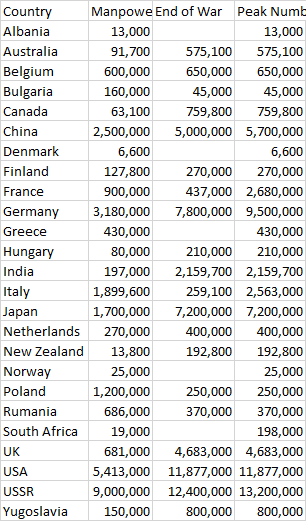 Country Manpower on Entry into War End of War Peak Number
Albania 13,000 13,000
Australia 91,700 575,100 575,100
Belgium 600,000 650,000 650,000
Bulgaria 160,000 45,000 45,000
Canada 63,100 759,800 759,800
China 2,500,000 5,000,000 5,700,000
Denmark 6,600 6,600
Finland 127,800 270,000 270,000
France 900,000 437,000 2,680,000
Germany 3,180,000 7,800,000 9,500,000
Greece 430,000 430,000
Hungary 80,000 210,000 210,000
India 197,000 2,159,700 2,159,700
Italy 1,899,600 259,100 2,563,000
Japan 1,700,000 7,200,000 7,200,000
Netherlands 270,000 400,000 400,000
New Zealand 13,800 192,800 192,800
Norway 25,000 25,000
Poland 1,200,000 250,000 250,000
Rumania 686,000 370,000 370,000
South Africa 19,000 198,000
UK 681,000 4,683,000 4,683,000
USA 5,413,000 11,877,000 11,877,000
USSR 9,000,000 12,400,000 13,200,000
Yugoslavia 150,000 800,000 800,000 -
I have added total mobilized:
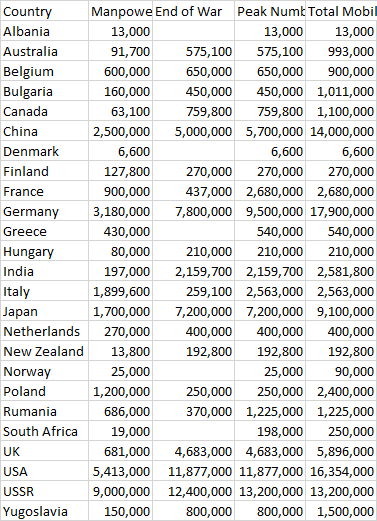 Country Manpower on Entry into War End of War Peak Number Total Mobilized
Albania 13,000 13,000 13,000
Australia 91,700 575,100 575,100 993,000
Belgium 600,000 650,000 650,000 900,000
Bulgaria 160,000 450,000 450,000 1,011,000
Canada 63,100 759,800 759,800 1,100,000
China 2,500,000 5,000,000 5,700,000 14,000,000
Denmark 6,600 6,600 6,600
Finland 127,800 270,000 270,000 270,000
France 900,000 437,000 2,680,000 2,680,000
Germany 3,180,000 7,800,000 9,500,000 17,900,000
Greece 430,000 540,000 540,000
Hungary 80,000 210,000 210,000 210,000
India 197,000 2,159,700 2,159,700 2,581,800
Italy 1,899,600 259,100 2,563,000 2,563,000
Japan 1,700,000 7,200,000 7,200,000 9,100,000
Netherlands 270,000 400,000 400,000 400,000
New Zealand 13,800 192,800 192,800 192,800
Norway 25,000 25,000 90,000
Poland 1,200,000 250,000 250,000 2,400,000
Rumania 686,000 370,000 1,225,000 1,225,000
South Africa 19,000 198,000 250,000
UK 681,000 4,683,000 4,683,000 5,896,000
USA 5,413,000 11,877,000 11,877,000 16,354,000
USSR 9,000,000 12,400,000 13,200,000 13,200,000
Yugoslavia 150,000 800,000 800,000 1,500,000
Hello! It looks like you're interested in this conversation, but you don't have an account yet.
Getting fed up of having to scroll through the same posts each visit? When you register for an account, you'll always come back to exactly where you were before, and choose to be notified of new replies (either via email, or push notification). You'll also be able to save bookmarks and upvote posts to show your appreciation to other community members.
With your input, this post could be even better 💗
Register Login