How would you rate countries and territories considering realism in big WWII maps.
-
After researching military stats and productions I have convinced that researching economic datas is simply misleading. the Soviets even incresed their production capacities after Barbarossa despite losing of huge territories to Axis.
Are you sure The Soviet Union wasn't anywhere near an advanced country with a per capita productivity like Germany or England?

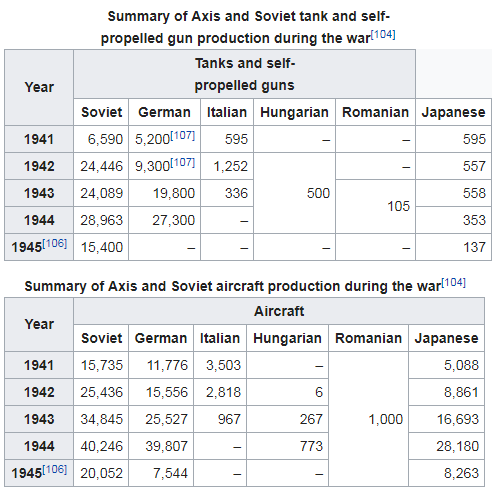
T-34 was among the best tanks in wwII also Soviets were capable of producting more tanks and aircraft than combine European Axis countries.
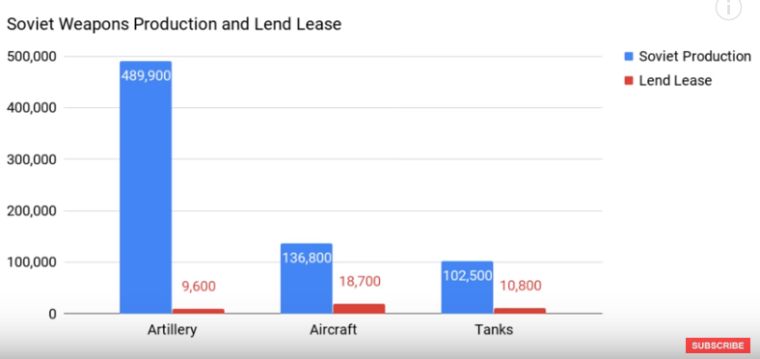
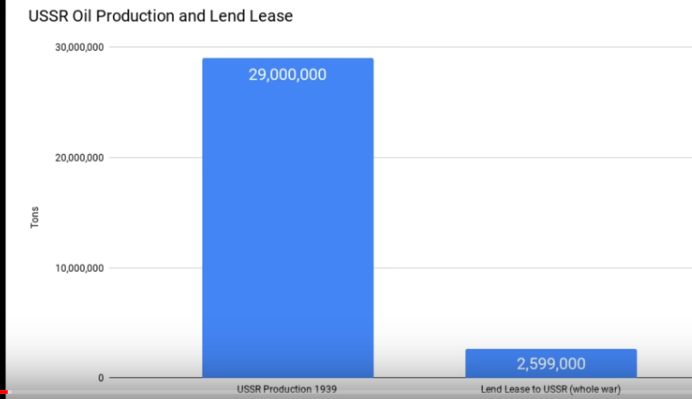
Also it is true that The British Empire had bigger fleet and capable bombers but The British Empire was also the main Lend-Lease receiver plus they were heavily dependent on trading with USA in the Atlantic. The impact of Lend Lease to the domestic Soviet production was around %5-%8 while The British Empire did receive threefold more war materials.
-
If you look the stats of Italian (1943-1945) and Western Front (1944-1945) Campaigns you will see The British Empire and the US did approxiamately devote the same amount of troops and war vehicles in this campaigns. They did send similar amount of Fighters/Bombers over Germany. USA contribution of defeating European Axis powers was not enormously bigger than the British contribution adn I would say their contributions were almost equal if you exluce lend lease I would say the European Axis powers were defeated with these following contribution rates; %60 Soviets %20 Biritish Empire and %20 USA.
-
@schulz It is the specific data on production that is misleading. Usually those voices are but a small part of the military expenditure of the country.
For example, a Pz III costs about 110,000 RM.
https://panzerworld.com/product-pricesIn 1942 Germany spent 100,000 millions RM in military expenses.
https://wiki.mises.org/wiki/Inflation_in_Nazi_GermanySo, since the Pz III in 1942 would be actually a bit above the average, the cost of producing those 9,000 armours was about the 1.0% of what Germany spended for the military.
If already focused on those volumes since the previous years, Germany could have produced 100,000 armours in 1942, spending 10% of it's military budget (plus other money to make them operative), also since 2 millions tons of steel was also about 10% of the steel production ability of Germany alone (domestic) in 1942 (of course, most of those armours would have been unable to operate, for lack of fuel; so that would have been a waste, as Germany was already unable to fully use the armours it had).
-
@schulz If you want the Military Expenditure, I guess you can refer to the reformatted COW @RogerCooper made and made available at this link:
http://www.rogercooper.com/documents/COW-Reformatted.xlsIn that one, for example, in 1942, the military expenditure of Germany is 39.2% of all listed and the military expenditure of Russia (that I suppose it means the Soviet Union) is 7.8% of all listed. All listed would be most of the world, but with the main issue of missing India.
From the COW site, I understand that all these entries were converted to US dollars at the current exchange rates.
The COW v5 gives, for 1942, 36,900,000 (I guess thousands of current US dollars) for Germany and 7,324,156 (I guess thousands of current US dollars) for Russia (I guess it is the Soviet Union).
Thus, if I'm reading it correctly, the above would mean that Germany spent 5.0 times what the Soviet Union did in 1942, for the military, at current exchange rates.
So, here you go. That would be the military expenditures, except that exchange rates are not necessarily very good for comparisons. -
Military expanditures are misleading like GDP. Saudi Arabia was supposed to defeat Yemen considering military expanditures. It shows how unreliable are both GDP and military expanditures.
I have better idea to determining realistic values or at least relative values among the main combatants.
List every countries' land, air and naval forces that engaged battles (exclude overproductions), multiplications with Triplea values, then determining how many units are represented by single Triplea unit then multiplications with them:
For example a country that had only 100.000 troops and 20 submarines (and assuminn real value gap between a soldier and submarine is 1000) and all of them engaged battles;
100.000x3=300.000
20x7x1000=140.000Total strenght is 440.000 simply=44 Pus It is relative strenght you can easily decrease or increase this relative value.
And one assumption more for example this country did lose twofold more solider than it's enemy in combats, In this situation the relative strenght was supposed to be:
100.000x3/2=150.000
20x7x1000=140.000Total strenght is 190.000 simply 19.
-
@schulz said in How would you rate countries and territories considering realism in big WWII maps.:
The impact of Lend Lease to the domestic Soviet production was around %5-%8 while The British Empire did receive threefold more war materials.
Looking at the lend lease as percentage of the GDP doesn't make much sense, as, aside stuff like net imports, you are not able to spend 100% of your GDP on the military (because you would just not be able to, and, cannibalism aside, everyone would die), while you can (and are actually supposed to) use the lend lease only for the military.
Also, for the lend lease to the USSR, you can use the site linked by @RogerCooper.
The lend lease to the Soviet Union was $11.3 thousands millions.
Additionally, the British sent stuff for £428 millions, that would be $1.7 thousands millions.
So, the total aid would be $13.0 thousands millions.
These are the COW military expenditures values in thousands of current dollars for the various years:
1942:7,324,156
1943:7,978,497
1944:8,094,563
1945:8,589,076
This sums up as $31,986,292 thousands.
So, in this rough approximation (that doesn't take into account the purchasing power, and excludes the 1941 expenditures while including the 1941 aids and includes all the 1945 expenditures, instead of only until the war's end) the lend lease would be:
41% of the military expenditures of Russia.
Mind you that, most likely, the lend lease is accounted into those expenditures, or allowed them therefrom (the Soviets might have given some of that stuff to civilians), and, if so, this would mean that of those $32 thousands millions, $19 were Russians and $13 from aids, and this would mean the aids increased the Soviet military expenditures by 68%.
However, I'm just taking data from internet, hopefully reading it correctly, without checking any sources or such; so take this as you will. -
@cernel said in How would you rate countries and territories considering realism in big WWII maps.:
Looking at the lend lease as percentage of the GDP doesn't make much sense
Agree. I had checked lend-lease as quantity;


-
@schulz So; this is an example of why it is not very insightful to just take the most famous items for comparisons, much like the cost of tank production being only about 1% of the total expenditures. Munitions were a considerable but minor part of the lend lease, and, of those, the most important item were lorries (1 armour can cost about 20 lorries).
So, evaluating stuff like lend lease would take a huge amount of research, and I assume a number of people have done that, as you would need to check if the stuff was being "lend-leased" at the right price (or maybe undercosted, to help the target nation), if the expenditures of that country are including those items or not (basically, the lend lease being counted twice), and then you would need to have a purchase power parity to tell the estimated real value, to compare the expenditures in the two currencies. And, still, if there is some critical raw material that only someone else can get for you, imports may be much more valuable of any average.I don't really know how much the lend lease impacted, but my guess is that its real value may be around 25% of the net Soviet military expenditure.
-
Lend-Lease is a bit debetable/complicated thing but I am pretty sure that Lend-Lease wasn't decisive or vital factor for the Soviets.
-
@schulz Saudi Arabia and Yemen have about the same population, which is relevant to the Saudi failure. As the Saudis have not really mobilized for war and their local allies are only interested in securing an independent South Yemen, the Saudis lack the resources on the ground to win. The Houthis are fully commited to the conflict and can win by defending.
-
Maybe we have to look other similar wwii games. HOI series is good example;I've found this one though it is just victory point map;
https://hoi4.paradoxwikis.com/images/4/4f/Victory_point_map.png
-
GDP Over Subsistence, normalized to 1000, for 1939. From the Maddison database, with a lot of interpolation. This is probably the best objective numbers you can get to determine production capacity. US & USSR dominate because of their large populations.
Colonies use modern boundaries (except India).GDP > Subsistence 1939
Algeria 8
Angola 1
Argentina 17
Australia 14
Austria 5
Belgium 9
Brazil 3
Bulgaria 3
Canada 16
Chile 3
China 27
Colombia 3
Côte d'Ivoire 1
Croatia 2
Cuba 2
Czechoslovakia 13
Denmark 5
Egypt 3
Estonia 1
Finland 2
France 43
Germany 91
Ghana 1
Greece 4
Guatemala 1
Hong Kong 1
Hungary 3
India 57
Indonesia 11
Iran 3
Iraq 1
Ireland 2
Italy 21
Japan 42
Kenya 1
Latvia 2
Lebanon 1
Lithuania 3
Luxembourg 1
Malaysia 2
Mexico 5
Morocco 2
Myanmar 1
Netherlands 9
New Zealand 3
Nigeria 5
Norway 3
Peru 1
Philippines 4
Poland 13
Portugal 2
Puerto Rico 1
Saudi Arabia 2
Slovakia 6
South Africa 8
South Korea 1
Spain 15
Sri Lanka 1
Sudan 1
Sweden 7
Switzerland 5
Syria 1
Taiwan 1
Thailand 1
Turkey 4
United Arab Emirates 1
United Kingdom 71
United States 246
Uruguay 2
USSR 137
Venezuela 1
Viet Nam 1
Yugoslavia 1 -
@RogerCooper Cool. This is actually Maddison post mortem 2018 right? I'm thinking to try something like this with the 2010 one and the 1937 year.
Also, I couldn't find explanations on the borders, so I wonder what does modern borders mean in term of what year exactly and does this apply like in the case of Germany, Poland and the Soviet Union, in that the German GDP for 1939 would be without East Prussia, Silesia, Stettin etc., while the GDP from East Prussia would go to USSR (Kaliningrad) and Poland, even back for 1939 data, not Germany, right? If so, Germany is probably considerably undervalued, as missing a bunch of valuable territories, while the sum of Germany, Austria, Czechoslovakia and Poland (by "modern" borders) would be very close to the condition of (Great) Germany at the start of 1940.
-
Algeria 8 Very overvalued maybe because of oil reserves?I would rate 3-5
Angola 1
Argentina 17 Slighly overvalued. 12-14 better
Australia 14
Austria 5
Belgium 9
Brazil 3 Undervalued. 6-9 better.
Bulgaria 3
Canada 16
Chile 3 Slighly undervalued.
China 27
Colombia 3
Côte d'Ivoire 1
Croatia 2
Cuba 2
Czechoslovakia 13 Overvalued.
Denmark 5
Egypt 3
Estonia 1
Finland 2
France 43
Germany 91
Ghana 1
Greece 4
Guatemala 1
Hong Kong 1
Hungary 3
India 57 Very overvalued. Should be less valuable than China.
Indonesia 11. Could be even slighly more valuable due to oil reserves
Iran 3 Undervalued. Oil reserves should be taken into account
Iraq 1 The same as Iran
Ireland 2
Italy 21
Japan 42
Kenya 1
Latvia 2
Lebanon 1
Lithuania 3
Luxembourg 1
Malaysia 2
Mexico 5
Morocco 2
Myanmar 1
Netherlands 9
New Zealand 3
Nigeria 5
Norway 3 Very undervalued. Should be more valuable than Denmark.
Peru 1
Philippines 4
Poland 13
Portugal 2 Slighly undervalued.
Puerto Rico 1
Saudi Arabia The same as Iran, Iraq
Slovakia 6 Overvalued.
South Africa 8
South Korea 1
Spain 15 Overvalued, the Spanish civil war was supposed to be taken into account
Sri Lanka 1
Sudan 1
Sweden 7
Switzerland 5
Syria 1
Taiwan 1
Thailand 1
Turkey 4 Very undervalued.
United Arab Emirates 1
United Kingdom 71
United States 246
Uruguay 2
USSR 137
Venezuela 1
Viet Nam 1
Yugoslavia 1 Very undervalued. -
@RogerCooper Three things:
I suggest you check Algeria (8 too much) and Venezuela (1 too little) (I'm guessing math errors there, in interpolating).
Why there is Czechoslovakia and Slovakia?
Also Nigeria at 5 is a bit surprising (but not too much).
(didn't look at the source at the moment) -
@Cernel said in How would you rate countries and territories considering realism in big WWII maps.:
@RogerCooper Three things:
I suggest you check Algeria (8 too much) and Venezuela (1 too little) (I'm guessing math errors there, in interpolating).
Why there is Czechoslovakia and Slovakia?
Also Nigeria at 5 is a bit surprising (but not too much).
(didn't look at the source at the moment)The interpolation process contains anomalies, With Algeria, the first figure for per capita gdp if for 1971. My interpolation technique puts the WW2 numbers close to that. For many non-western countries, the first figure is for 1950, I will need to seek better figures for 1950.
I forget to remove Slovakia.I will develop a mask worksheet to prevent double-counting of countries, rather than fixing the results
Venezuela had only 3.6 million people in 1939.
Nigeria benefits from a relatively large population, a result of relatively benign British colonialism. By contrast, Belgian rule reduces the population of the Congo by 25% (a worse record than Stalin).
-
@Schulz said in How would you rate countries and territories considering realism in big WWII maps.:
Algeria 8 Very overvalued maybe because of oil reserves?I would rate 3-5
This is result of the interpolation process working backwards from 1971. I will try to get some other figuresBrazil 3 Undervalued. 6-9 better.
Maddison give a per capita GDP of 1139, (subsistence = 700). Maddison's number looks low to me, Brazil did have some industrial developmentCzechoslovakia 13 Overvalued.
Czechoslovakia was the most industrialized portion of the former Hapsburg empire and had a major armaments industry (The Krupp Works).India 57 Very overvalued. Should be less valuable than China.
India's military potential was great, but the India's local politicians opposed fighting unless the British granted independence.Indonesia 11. Could be even slighly more valuable due to oil reserves
Iran 3 Undervalued. Oil reserves should be taken into account
Maddison is based entirely on GDP. Some special consideration should be given to oil, but remember the US produced 2/3 of the world's oil during WW2Iraq 1 The same as Iran
Iraq's oil industry was post WW2Norway 3 Very undervalued. Should be more valuable than Denmark.
Denmark had more people and more industry than Norway.Saudi Arabia The same as Iran, Iraq
Oil was not developed in Saudi Arabia until the 1950'sSlovakia 6 Overvalued.
This should not have been on the listSpain 15 Overvalued, the Spanish civil war was supposed to be taken into account
Maddison shows Spain as having a higher standard of living than Italy. That seems odd to me as wellTurkey 4 Very undervalued.
Turkey was a very poor country, with a standard of living about the same as India. While A&A games often give Turkey a large military force, its military was small for the size of the country and poorly equipped. In 1941, the Turkish government was desperately pleading for military equipment from the BritishYugoslavia 1 Very undervalued.
More extreme povertyI need to work some more with Maddison database. Perhaps averaging it with Correlates of War may get better results than either on their own.
-
I'm looking at both Maddison 2010 and Maddison 2018, and I see stuff changed a lot, not only in making India much more powerful.
I see that the 2018 Maddison greatly increased the estimated value of the Soviet Union, from the 2010 one.
In Maddison 2010 the 1937 GDP per capita of the USSR was 33.5% that of the USA, while in Maddison 2018 it is 41.2% (4307/10450).
For the USSR/Germany ratio, that is probably what matters the most in WW2, the change has been from 46.0% to 66.0%, for 1937.
So, the 2018 version has bumped the Soviet purchase power a lot, of a +23% when compared to the USA and +44% when compared to Germany.
So, using Maddison 2018 is going to give a much weaker Germany (and also a much weaker Italy) than using Maddison 2010.
Here I found an article that comments the changes, saying that, in Maddison 2018 "The USSR was also supposedly slightly richer than Italy, at the level of countries such as Austria and Finland, and only marginally behind the UK, France, and Germany as late as the early 1980s.".
http://www.unz.com/akarlin/latest-release-of-maddison-project-was-russia-richer-than-previously-thought/ -
Oil reserves (also other natural resources) should be only taken into account partially because oil rich countries won't gain too much when they capture these territories while other countries benefit them too much.
I mean for example capturing Sumatra will gain more to Japan rather than USA.
I've noticed also Romania is missing.
Turkey was weak but definitely deserves more Pus when Greece is 4 plus some natural resources like chromium.
Also how come Yugoslavia 1 while Croatia is 2?
Why there is huge gap between United Kingdom and France?
-
@Schulz said in How would you rate countries and territories considering realism in big WWII maps.:
Also how come Yugoslavia 1 while Croatia is 2?
Well spotted. Probably Croatia was not meant to be there.
Since it is GDP above subsistence, this could be possible if Yugoslavia outside Croatia had a GDP under the subsistence figure, but almost surely this is either a math error for at least one of the two or a huge discrepancy from interpolating or extrapolating.