How would you rate countries and territories considering realism in big WWII maps.
-
I don't think India is more valauble than Japan, the database is debatable. California's GDP is higher than Russia can you claim that California could have defeated Russia in a war if she was independent country? No. Is California richer than Russia in terms of natural resources? No. Could California have produced every Russian military assets by it's own? No. The answer is clear. California should not be more valued than Russia like India should not be more valued than Japan.
My proposal would be giving air base to Pacific Islands and they give air units to +1/+2 movement power.
-
@schulz I suppose here you are not talking about World War 2. In 1940 California had 6,837,688 people, that is about 5.2% of the 131,669,275 people for the entire United States of America (by period borders (thus without Hawaii, etc.), but the difference is less than half a million). Assuming the California income is average with the rest of its country, starting with 263 for the United States of America, this would put California at 14, that is lower than Argentina at 19, let alone the Soviet Union at 150.
The problem with India is that India was about the same deal as China, except that India was a lot better than China. So, whatever value you give India, you should give less to China. By those values, China is 30, but since that is all of China, comprising Manchuria, that means that China in 1940 would have a production of 10 to 15, already (and Japan would have 15 to 20 additional production from occupied China). If you cut India to half, then you have to cut China to half too, to 5 to 7 production remaining, and then you will be left with the China push over, v3 1941 style, that makes no sense (since China fought Japan alone for years, to almost standstill, from 1939 until 1944, and increased the size of its army a lot over the period).
-
Yes my example was based on the current GDP's just intented to show GDP's are not reliable alone. Also agree making India more valuable does not make sense to me. Maybe better to mix playability and realism.
-
@schulz India's military contribution was not insignificant. India mobilized 2.6 million men, more than Australia, Canada & South Africa combined. It's military contribution would have been greater if the British had made more efficient use of its resources. However Churchill wanted to hold India after the war and did not want to give local politicians control of the government and have them have a powerful military, Whatever resources are available, governments can use them with less than 100% efficiency (and 0% efficiency is possible),
China had a lot more commitment to the war. It mobilized 14 million men.
-
@rogercooper Still I doubt that can put India at more than half of United Kingdom and about 50% more than Japan, for WW2 PUs production. However, India was poor, yet not as poor as we tend to think, based mostly on images we have from the seventies, eighties or such (like when Mother Teresa won the Nobel Peace Prize or Dominique Lapierre wrote City of Joy).
The Maddison database shows it; for example, you can see the following "cgdppc":
1931: 1520
1941: 1532
1951: 1426
1961: 1378
1971: 1237
1981: 1109
1991: 1297
2001: 2086According to Maddison, the nadir was in 1985 at 1021, while, previous to that, the zenith was in 1943 at 1559; exactly the year when millions of Indians died of hunger (but the bad harvests were in the previous year; the 1943 ones were good).
So, India kept going down and down after WW2, until the eighties, when it reached that widespread level of poverty (almost as bad as China during WW2) that we usually associate to it before the nineties.
Of course, India's contribute to the war effort in term of share of its own GDP was much lower than that of the United Kingdom, and cutting the subsistence income out of the GDP is a way to represent it, tho it might be still not quite enough. On the other hand, the value for China looks good enough to me, in the moment you have to consider you also need to cut it by about half (since about half of that GDP is in Japanese hands (merely making a guess here)).
A thing that is surprising me is to see these values:
cgdppc:
1937: 1478
1938: 1466
1939: 1483
1940: 1516
1941: 1532
1942: 1512
1943: 1559
1944: 1531
1945: 1494
1946: 1404I was expecting the value for 1942 to be a lot lower than 1941 (like at least 100 points), since that is the year of the crop failures that lead to the famine of 1943, but it seems to be only slightly lower. No idea if this means that those crops failures don't actually impact that much or Maddison is taking the side of those that say that the famine was mostly man-made or that same year industrial output compensated the agricultural one or what.
-
@rogercooper said in How would you rate countries and territories considering realism in big WWII maps.:
@cernel The Maddison database uses 1991 boundaries. Except when it doesn't. I will cleanup/interpolate the data to make it more usable for game designers.
I will give the data with pre-war boundaries except for the colonies where I will use contemporary boundaries.
If it is true that Maddison uses the 1991 borders, the value you are giving for India would exclude Bangladesh and Pakistan. Thus, for WW2, you would need to increase it by about 19%, in this case becoming as high as 76, that would mean India being almost as powerful as the United Kingdom, and almost twice as powerful as Japan, even after cutting the subsistence income at 700 (without doing that, India would be almost 50% more powerful than the United Kingdom and more than 160% more powerful than Japan). Practically, giving the WW2 value for India, you would need to get India + Bangladesh + Pakistan, but these last two have values only starting from 1950 (so, I guess the only way is extrapolating them).
-
@cernel By searching in internet, I found second hand references that say that, in 1943, the proportion of national income spent on defence was:
47% for the United Kingdom of Great Britain and Northern Ireland;
16.4% for India.Sources:
https://warwick.ac.uk/fac/soc/economics/staff/mharrison/public/ehr88postprint.pdf
http://www.global.ucsb.edu/punjab/sites/secure.lsit.ucsb.edu.gisp.d7_sp/files/sitefiles/journals/volume20/11-Sukhdev Sohal 20.pdfSo, in the Maddison database, these would be the GDP for 1943, normalized to 2011 US$ prices (I'm not cutting any subsistence income here):
511,553 millions for the United Kingdom of Great Britain and Northern Ireland;
625,003 millions for India.Reference:
Maddison Project Database, version 2018. Bolt, Jutta, Robert Inklaar, Herman de Jong and Jan Luiten van Zanden (2018),
“Rebasing ‘Maddison’: new income comparisons and the shape of long-run economic development”
Maddison Project Working Paper, nr. 10, available for download at www.ggdc.net/maddison.Applying the given percentages of national income spent on defence to these values, the results for the "real" income spent on defence would be:
240 thousands millions for the United Kingdom of Great Britain and Northern Ireland;
103 thousands millions for India.So, according to these data and the way I used them, the "real" contribute of India to the war effort in 1943 would be about 43% that of the United Kingdom of Great Britain and Northern Ireland (surprisingly in line with the 8 and 3 production values assigned respectively to United Kingdom and India in all Axis & Allies games from Classic to 1942 Second Edition). This is little more than half the 78% @rogercooper got by getting the GDP above subsistence.
https://forums.triplea-game.org/topic/1054/how-would-you-rate-countries-and-territories-considering-realism-in-big-wwii-maps/54?lang=it&page=3However, this likely doesn't take into account the sunken costs of raising men for the military, as that reduces your GDP; so one may want to take a look at how many men were raised in India and take a guess at how much the United Kingdom GDP would have suffered if as many men would have been taken from the population of the same, while, on the other hand, taking men from India is almost cost free, due to the size of the population and the low GDP per capita, even without considering the fact that India was overpopulated (after all, several millions Indians died of hunger in 1943). So, this might increase the bonus production from India to the United Kingdom over 43%, if that 43% figure is correct.
In any case, it appears hard to justify valuing India more than half the value of the United Kingdom of Great Britain and Northern Ireland, as those values would do even after cutting the subsistence income.
-
@cernel The figures before partition include Pakistan and Bangladesh under India. This is discussed in Maddison's book.
-
@rogercooper Can you give a link to that and wherever it says stuff like that (also relatively if the Soviet Union includes the Baltics). I've been unable to find anything the like, till now. Anyways, I should have guessed, since of the population drop in 1947. Editing.
-
Also, is there somewhere the list of the monetary values that they are using as starting points? For example, something telling the (estimated) India GDP in rupees (I mean of that time, not adjusted by inflation or anything) in 1943. I'm unable to find anything but the final values. I cannot even find the final GDP values (tho those are easily obtained by multiplying the GDP per capita by the population, except when there is no population value (South Africa)).
-
@cernel said in How would you rate countries and territories considering realism in big WWII maps.:
@rogercooper Can you give a link to that and wherever it says stuff like that (also relatively if the Soviet Union includes the Baltics). I've been unable to find anything the like, till now. Anyways, I should have guessed, since of the population drop in 1947. Editing.
I can't give you a link. It was in the printed book. ISBN-13: 978-9264022614.
As they are using PPP (purchasing power parity), the conversion process is complex. I am working on interpolating all the new data. However, it seems reasonable to say that India's military potential was half that of Great Britain itself, but much of that potential went unused because of Indian nationalism and British fear of Indian nationalism.
-
@rogercooper said in How would you rate countries and territories considering realism in big WWII maps.:
As they are using PPP (purchasing power parity), the conversion process is complex. I am working on interpolating all the new data. However, it seems reasonable to say that India's military potential was half that of Great Britain itself, but much of that potential went unused because of Indian nationalism and British fear of Indian nationalism.
Actually, I was not asking to know what they were doing to get to the final value, just if they were giving somewhere the nominal estimated GDP for the country, as accounted at those times, with the money at the time for that country (I guess the answer is not online).
I meant something like this:
https://www.measuringworth.com/datasets/ukgdp/
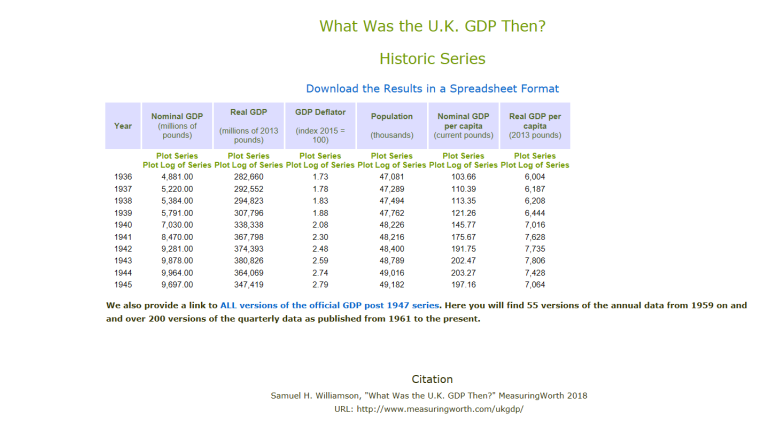
or this:
https://www.measuringworth.com/datasets/usgdp/
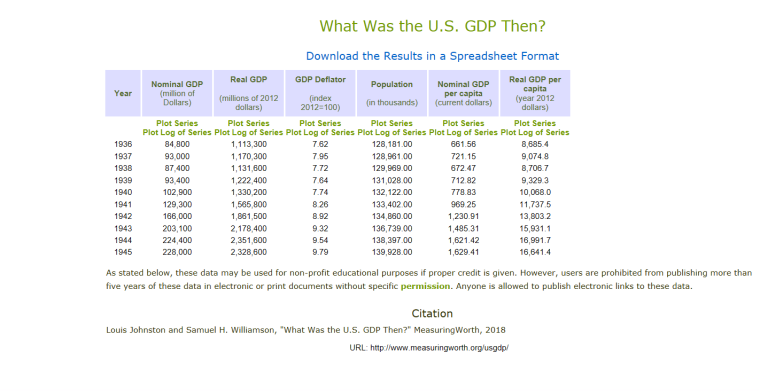
In this site you can find the nominal GDP, but only for a few countries (and they might not be the same values that Maddison is using):
https://www.measuringworth.com/ -
The various releases of Maddison's have these values for the 1937 CGDP per capita of United Kingdom, India, and China, respectively:
2018: 8384, 1478, 997.
2013: 6218, 676, 580
2010: 6218, 676, 580So, relatively to the United Kingdom, these are the percentages:
2018: 100.0%, 17.6%, 11.9%
2013: 100.0%, 10.9%, 9.3%
2010: 100.0%, 10.9%, 9.3%And these are the ratio India/China:
2018: 1.48
2013: 1.16
2010: 1.16Those are some massive differences, especially if we are cutting the subsistence income.
- From 2010 to 2013, no changes.
- From 2013 (as well as 2010) to 2018 they relatively increased China by a modest yet consistent 27.5% (as a ratio of the ratio), but greately increased India by a massive 62.2% (and this is an ever more massive boost if you cut the subsistence income), ending in the condition (we have seen) where India has a GDP consistently bigger than the United Kingdom, and at about 3/4 of the same after you cut the subsistence income.
As much as I believe that India was very important in World War 2, I strongly doubt its warmaking potential can be above 50% the one of the United Kingdom (alone). The 2018 values, moreover, make impossible to feasibly adjust it in any ways I can imagine, as, in doing so, you would make China way too weak, instead (keeping in mind that you'll have to cut it a lot thereafter, as the most productive part of China was in Japanese hands, by the start of WW2).
I'm thinking that for these 3 powers the values that would make the most sense with my expectations are the ones of 2010 (the actual Maddison), as long as still cutting the subsistence income.
Based on the article I linked, the subsistence income would be 694 US dollars for the 2018 version and, for the other ones, I think it would be consistent the most to use this figure and adjust it by the United States of America inflation at consumer price.
https://data.worldbank.org/indicator/FP.CPI.TOTL?end=2011&locations=US&start=1990&view=chart
that would mean at 1990 prices the same poverty level would be 403 US Dollars.In this case, if we use the 2010 data for 1937 and cut the per capita by 403 US Dollars, this is what we obtain:
Country: GDPPC: GDPPC above subsistence: GDP above subsistence in millions: ratio to the United Kingdom
Soviet Union: 2,156: 1,753: 323,649: 117.7%*
United Kingdom: 6,218: 5,815: 274,986: 100.0%
Japan: 2,315: 1,912: 136,284: 49.7%
Italy: 3,319: 2,916: 125,586: 45.7%
India: 676: 273: 101,256: 36.8%
China: 580: 177: 90,383: 32.9%**
*The Soviet Union would be actually about 60% of this, in 1942, due to territorial losses to the Germans etc..
**China would be actually about half of this, as about half is Japanese etc. occupied.This looks good to me, and this way India would be less powerful than Japan, as we would expect (still India would be 74.30% of Japan, that, for example, would mean that if the United Kingdom is 8, then Japan is 4 and India is 3).
p.s.: I haven't double checked much, so I might have made calculations blunders. Let me know, in case.
EDIT: Previously I got the wrong value for 2013. It is actually the same as 2010.
-
Definitely you underestimate the Soviets.
The Soviets are definitely undervalued in this data probably due to Socialist economy, determining of the values of assets is problematic.
Were Soviets only %17.7 stronger than the UK even in 1937? Soviets did produce 2.5 more Tanks and artillery, %50 more machine guns and the Soviets had 3 times more personnels then the Biritsh Empire let alone the UK. Also great depression didn't affect the Soviet Economy. Though western part of USSR was occupied and Soviet caualties were enormous in the initial stage of war. If we play a 1939 or 1940 scenario, Soviets can easily avoid from this enormous losses.
Actually by just looking military productions, we can easily determine the real values of countries. Just we have to be sure that how much units are represented with one land/naval/air unit?
-
@schulz The Soviet Union wasn't anywhere near an advanced country with a per capita productivity like Germany or England. Much like Japan, it was an underdeveloped country that was partially developing, and, since that data is for the whole, it includes much population outside of Russia, that still lived in hardly modern conditions. But also in Russia a lot of people, especially in the countryside, still lived in backward and poor conditions, as the Germans soldiers noticed very clearly after invading. While as a matter of industrial productivity the Soviet Union was catching up, its agricultural productivity was still considerably underdeveloped (labour intensive). So, a figure for Russia having the same per capita income as Japan, but 2 to 3 times the GDP, thanks to the bigger population, appears totally reasonable, overall.
As a matter of weapons, for example in relation to the United Kingdom, you have to take into account that the Soviets focused on producing relatively cheap stuff, had, and kept having, massive losses, thus they could spend on replacing their losses, rather than upkeeping existent armies, had a huge stock of trains and stuff at the start of the war, so they were able to focus almost entirely on producing weapons, and didn't have to spend on naval and merchant marine as much as the United Kingdom did, that still managed to also keep up a bombing campaign on Germany about as strong as the United States one, that is a very costly effort too. Meanwhile, the British Empire mobilized more than 6 million men for the UK alone, another 3 millions for India and surrounding countries (Nepal etc.), another 2 millions for the Dominions (mostly Canada and Australia), and about another half a million for all the rest, that is more than 11 millions in total, and without anywhere near the losses the Soviets had (having losses is good for your production, as I said, as you can focus more on it than on upkeeping existing armed forces).
This said, it is true that GDP values tend to overestimate capital intensive countries, as you don't take into account capital depreciation, that is the factual consumption of existing investments for producing goods. Also, everything is estimated and, for example, the 2018 Maddison values give a relatively stronger Soviet Union than the 2010 ones, but if you use the 2018 Maddison you will also have an India that has higher GDP than the United Kingdom, and still about 3/4 of the UK GDP even after you cut the subsistence income (and the figure would be surely even bigger if we would be using the NDP, as India having a much lower value of investments than the UK).
-
@schulz said in How would you rate countries and territories considering realism in big WWII maps.:
Definitely you underestimate the Soviets.
The Soviets are definitely undervalued in this data probably due to Socialist economy, determining of the values of assets is problematic.
I've not contributed in any ways to the creation of the Maddison database, and the cutting of the subsistence income I've made doesn't impact greatly on countries with GDP of 4 or more times the subsistence income. Cutting the subsistence income makes the Soviet Union weaker with respect to the United Kingdom, but, if you don't do that, India will be much stronger, counterbalancing the effect for the British Empire as a whole (and with the 2018 one, India alone will be 2/3 the GDP of the Soviet Union).
CGDPPC ratio between the Soviet Union and the United Kingdom in Maddison's versions, for 1937 and 1940, respectively:
2018: 4307/8384=51.6%, 4282/9264=46.2%
2010: 2156/6218=34.7%, 2144/6856=31.3%
(2013 is the same as 2010)So, it seems that 2010 Maddison considered the Soviet Union per capita being about 1/3 of the United Kingdom one, while in the 2018 version they increased this figure to about 1/2. So, the Soviet Union is going to be about 50% more powerful in the 2018 version than in the 2010 one (and more than 50% after cutting subsistence).
Another advantage of the 2010 is that it clarifies that the Baltic Countries are, apparently, considered part of the Soviet Union, while I don't see this clarification for the 2018 one, where the data are (and since Maddison was British, but lived and worked in the Netherlands, and the new database is based in the Netherlands as well, but they both use the currency of the United States of America as benchmark, I'm not sure what countries perspective would be the default).
https://en.wikipedia.org/wiki/State_continuity_of_the_Baltic_states#List_of_recognition_and_non-recognition_of_annexation
United States – maintained official diplomatic relations, neither de jure nor de facto recognition accorded.
United Kingdom – maintained semi official diplomatic relations, de facto recognition accorded.
Netherlands – implicit de jure recognition in 1942, when diplomatic relations were established with the USSR without reservation. -
After researching military stats and productions I have convinced that researching economic datas is simply misleading. the Soviets even incresed their production capacities after Barbarossa despite losing of huge territories to Axis.
Are you sure The Soviet Union wasn't anywhere near an advanced country with a per capita productivity like Germany or England?
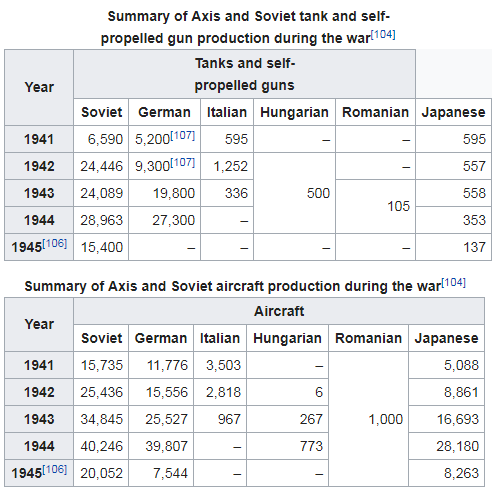
T-34 was among the best tanks in wwII also Soviets were capable of producting more tanks and aircraft than combine European Axis countries.
Also it is true that The British Empire had bigger fleet and capable bombers but The British Empire was also the main Lend-Lease receiver plus they were heavily dependent on trading with USA in the Atlantic. The impact of Lend Lease to the domestic Soviet production was around %5-%8 while The British Empire did receive threefold more war materials.
-
If you look the stats of Italian (1943-1945) and Western Front (1944-1945) Campaigns you will see The British Empire and the US did approxiamately devote the same amount of troops and war vehicles in this campaigns. They did send similar amount of Fighters/Bombers over Germany. USA contribution of defeating European Axis powers was not enormously bigger than the British contribution adn I would say their contributions were almost equal if you exluce lend lease I would say the European Axis powers were defeated with these following contribution rates; %60 Soviets %20 Biritish Empire and %20 USA.
-
@schulz It is the specific data on production that is misleading. Usually those voices are but a small part of the military expenditure of the country.
For example, a Pz III costs about 110,000 RM.
https://panzerworld.com/product-pricesIn 1942 Germany spent 100,000 millions RM in military expenses.
https://wiki.mises.org/wiki/Inflation_in_Nazi_GermanySo, since the Pz III in 1942 would be actually a bit above the average, the cost of producing those 9,000 armours was about the 1.0% of what Germany spended for the military.
If already focused on those volumes since the previous years, Germany could have produced 100,000 armours in 1942, spending 10% of it's military budget (plus other money to make them operative), also since 2 millions tons of steel was also about 10% of the steel production ability of Germany alone (domestic) in 1942 (of course, most of those armours would have been unable to operate, for lack of fuel; so that would have been a waste, as Germany was already unable to fully use the armours it had).
-
@schulz If you want the Military Expenditure, I guess you can refer to the reformatted COW @RogerCooper made and made available at this link:
http://www.rogercooper.com/documents/COW-Reformatted.xlsIn that one, for example, in 1942, the military expenditure of Germany is 39.2% of all listed and the military expenditure of Russia (that I suppose it means the Soviet Union) is 7.8% of all listed. All listed would be most of the world, but with the main issue of missing India.
From the COW site, I understand that all these entries were converted to US dollars at the current exchange rates.
The COW v5 gives, for 1942, 36,900,000 (I guess thousands of current US dollars) for Germany and 7,324,156 (I guess thousands of current US dollars) for Russia (I guess it is the Soviet Union).
Thus, if I'm reading it correctly, the above would mean that Germany spent 5.0 times what the Soviet Union did in 1942, for the military, at current exchange rates.
So, here you go. That would be the military expenditures, except that exchange rates are not necessarily very good for comparisons.
Hello! It looks like you're interested in this conversation, but you don't have an account yet.
Getting fed up of having to scroll through the same posts each visit? When you register for an account, you'll always come back to exactly where you were before, and choose to be notified of new replies (either via email, or push notification). You'll also be able to save bookmarks and upvote posts to show your appreciation to other community members.
With your input, this post could be even better 💗
Register Login