How would you rate countries and territories considering realism in big WWII maps.
-
@schulz said in How would you rate countries and territories considering realism in big WWII maps.:
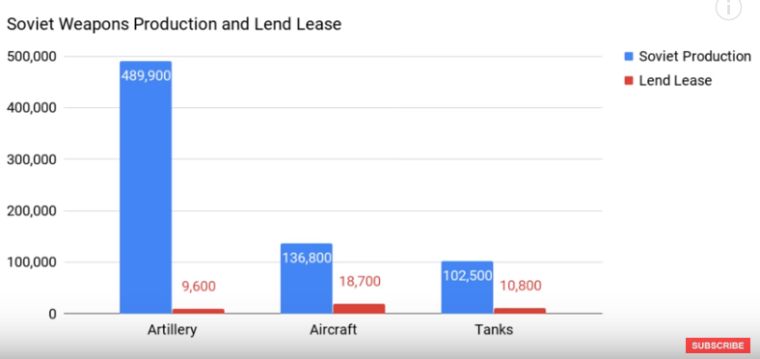
The impact of Lend Lease to the domestic Soviet production was around %5-%8 while The British Empire did receive threefold more war materials.
Looking at the lend lease as percentage of the GDP doesn't make much sense, as, aside stuff like net imports, you are not able to spend 100% of your GDP on the military (because you would just not be able to, and, cannibalism aside, everyone would die), while you can (and are actually supposed to) use the lend lease only for the military.
Also, for the lend lease to the USSR, you can use the site linked by @RogerCooper.
The lend lease to the Soviet Union was $11.3 thousands millions.
Additionally, the British sent stuff for £428 millions, that would be $1.7 thousands millions.
So, the total aid would be $13.0 thousands millions.
These are the COW military expenditures values in thousands of current dollars for the various years:
1942:7,324,156
1943:7,978,497
1944:8,094,563
1945:8,589,076
This sums up as $31,986,292 thousands.
So, in this rough approximation (that doesn't take into account the purchasing power, and excludes the 1941 expenditures while including the 1941 aids and includes all the 1945 expenditures, instead of only until the war's end) the lend lease would be:
41% of the military expenditures of Russia.
Mind you that, most likely, the lend lease is accounted into those expenditures, or allowed them therefrom (the Soviets might have given some of that stuff to civilians), and, if so, this would mean that of those $32 thousands millions, $19 were Russians and $13 from aids, and this would mean the aids increased the Soviet military expenditures by 68%.
However, I'm just taking data from internet, hopefully reading it correctly, without checking any sources or such; so take this as you will. -
@cernel said in How would you rate countries and territories considering realism in big WWII maps.:
Looking at the lend lease as percentage of the GDP doesn't make much sense
Agree. I had checked lend-lease as quantity;
-
@schulz So; this is an example of why it is not very insightful to just take the most famous items for comparisons, much like the cost of tank production being only about 1% of the total expenditures. Munitions were a considerable but minor part of the lend lease, and, of those, the most important item were lorries (1 armour can cost about 20 lorries).
So, evaluating stuff like lend lease would take a huge amount of research, and I assume a number of people have done that, as you would need to check if the stuff was being "lend-leased" at the right price (or maybe undercosted, to help the target nation), if the expenditures of that country are including those items or not (basically, the lend lease being counted twice), and then you would need to have a purchase power parity to tell the estimated real value, to compare the expenditures in the two currencies. And, still, if there is some critical raw material that only someone else can get for you, imports may be much more valuable of any average.I don't really know how much the lend lease impacted, but my guess is that its real value may be around 25% of the net Soviet military expenditure.
-
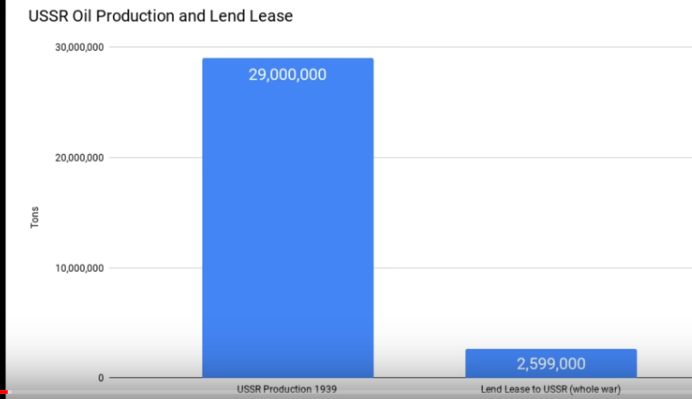
Lend-Lease is a bit debetable/complicated thing but I am pretty sure that Lend-Lease wasn't decisive or vital factor for the Soviets.
-
@schulz Saudi Arabia and Yemen have about the same population, which is relevant to the Saudi failure. As the Saudis have not really mobilized for war and their local allies are only interested in securing an independent South Yemen, the Saudis lack the resources on the ground to win. The Houthis are fully commited to the conflict and can win by defending.
-
Maybe we have to look other similar wwii games. HOI series is good example;I've found this one though it is just victory point map;
https://hoi4.paradoxwikis.com/images/4/4f/Victory_point_map.png
-
GDP Over Subsistence, normalized to 1000, for 1939. From the Maddison database, with a lot of interpolation. This is probably the best objective numbers you can get to determine production capacity. US & USSR dominate because of their large populations.
Colonies use modern boundaries (except India).GDP > Subsistence 1939
Algeria 8
Angola 1
Argentina 17
Australia 14
Austria 5
Belgium 9
Brazil 3
Bulgaria 3
Canada 16
Chile 3
China 27
Colombia 3
Côte d'Ivoire 1
Croatia 2
Cuba 2
Czechoslovakia 13
Denmark 5
Egypt 3
Estonia 1
Finland 2
France 43
Germany 91
Ghana 1
Greece 4
Guatemala 1
Hong Kong 1
Hungary 3
India 57
Indonesia 11
Iran 3
Iraq 1
Ireland 2
Italy 21
Japan 42
Kenya 1
Latvia 2
Lebanon 1
Lithuania 3
Luxembourg 1
Malaysia 2
Mexico 5
Morocco 2
Myanmar 1
Netherlands 9
New Zealand 3
Nigeria 5
Norway 3
Peru 1
Philippines 4
Poland 13
Portugal 2
Puerto Rico 1
Saudi Arabia 2
Slovakia 6
South Africa 8
South Korea 1
Spain 15
Sri Lanka 1
Sudan 1
Sweden 7
Switzerland 5
Syria 1
Taiwan 1
Thailand 1
Turkey 4
United Arab Emirates 1
United Kingdom 71
United States 246
Uruguay 2
USSR 137
Venezuela 1
Viet Nam 1
Yugoslavia 1 -
@RogerCooper Cool. This is actually Maddison post mortem 2018 right? I'm thinking to try something like this with the 2010 one and the 1937 year.
Also, I couldn't find explanations on the borders, so I wonder what does modern borders mean in term of what year exactly and does this apply like in the case of Germany, Poland and the Soviet Union, in that the German GDP for 1939 would be without East Prussia, Silesia, Stettin etc., while the GDP from East Prussia would go to USSR (Kaliningrad) and Poland, even back for 1939 data, not Germany, right? If so, Germany is probably considerably undervalued, as missing a bunch of valuable territories, while the sum of Germany, Austria, Czechoslovakia and Poland (by "modern" borders) would be very close to the condition of (Great) Germany at the start of 1940.
-
Algeria 8 Very overvalued maybe because of oil reserves?I would rate 3-5
Angola 1
Argentina 17 Slighly overvalued. 12-14 better
Australia 14
Austria 5
Belgium 9
Brazil 3 Undervalued. 6-9 better.
Bulgaria 3
Canada 16
Chile 3 Slighly undervalued.
China 27
Colombia 3
Côte d'Ivoire 1
Croatia 2
Cuba 2
Czechoslovakia 13 Overvalued.
Denmark 5
Egypt 3
Estonia 1
Finland 2
France 43
Germany 91
Ghana 1
Greece 4
Guatemala 1
Hong Kong 1
Hungary 3
India 57 Very overvalued. Should be less valuable than China.
Indonesia 11. Could be even slighly more valuable due to oil reserves
Iran 3 Undervalued. Oil reserves should be taken into account
Iraq 1 The same as Iran
Ireland 2
Italy 21
Japan 42
Kenya 1
Latvia 2
Lebanon 1
Lithuania 3
Luxembourg 1
Malaysia 2
Mexico 5
Morocco 2
Myanmar 1
Netherlands 9
New Zealand 3
Nigeria 5
Norway 3 Very undervalued. Should be more valuable than Denmark.
Peru 1
Philippines 4
Poland 13
Portugal 2 Slighly undervalued.
Puerto Rico 1
Saudi Arabia The same as Iran, Iraq
Slovakia 6 Overvalued.
South Africa 8
South Korea 1
Spain 15 Overvalued, the Spanish civil war was supposed to be taken into account
Sri Lanka 1
Sudan 1
Sweden 7
Switzerland 5
Syria 1
Taiwan 1
Thailand 1
Turkey 4 Very undervalued.
United Arab Emirates 1
United Kingdom 71
United States 246
Uruguay 2
USSR 137
Venezuela 1
Viet Nam 1
Yugoslavia 1 Very undervalued. -
@RogerCooper Three things:
I suggest you check Algeria (8 too much) and Venezuela (1 too little) (I'm guessing math errors there, in interpolating).
Why there is Czechoslovakia and Slovakia?
Also Nigeria at 5 is a bit surprising (but not too much).
(didn't look at the source at the moment) -
@Cernel said in How would you rate countries and territories considering realism in big WWII maps.:
@RogerCooper Three things:
I suggest you check Algeria (8 too much) and Venezuela (1 too little) (I'm guessing math errors there, in interpolating).
Why there is Czechoslovakia and Slovakia?
Also Nigeria at 5 is a bit surprising (but not too much).
(didn't look at the source at the moment)The interpolation process contains anomalies, With Algeria, the first figure for per capita gdp if for 1971. My interpolation technique puts the WW2 numbers close to that. For many non-western countries, the first figure is for 1950, I will need to seek better figures for 1950.
I forget to remove Slovakia.I will develop a mask worksheet to prevent double-counting of countries, rather than fixing the results
Venezuela had only 3.6 million people in 1939.
Nigeria benefits from a relatively large population, a result of relatively benign British colonialism. By contrast, Belgian rule reduces the population of the Congo by 25% (a worse record than Stalin).
-
@Schulz said in How would you rate countries and territories considering realism in big WWII maps.:
Algeria 8 Very overvalued maybe because of oil reserves?I would rate 3-5
This is result of the interpolation process working backwards from 1971. I will try to get some other figures
Brazil 3 Undervalued. 6-9 better.
Maddison give a per capita GDP of 1139, (subsistence = 700). Maddison's number looks low to me, Brazil did have some industrial development
Czechoslovakia 13 Overvalued.
Czechoslovakia was the most industrialized portion of the former Hapsburg empire and had a major armaments industry (The Krupp Works).
India 57 Very overvalued. Should be less valuable than China.
India's military potential was great, but the India's local politicians opposed fighting unless the British granted independence.
Indonesia 11. Could be even slighly more valuable due to oil reserves
Iran 3 Undervalued. Oil reserves should be taken into account
Maddison is based entirely on GDP. Some special consideration should be given to oil, but remember the US produced 2/3 of the world's oil during WW2
Iraq 1 The same as Iran
Iraq's oil industry was post WW2
Norway 3 Very undervalued. Should be more valuable than Denmark.
Denmark had more people and more industry than Norway.
Saudi Arabia The same as Iran, Iraq
Oil was not developed in Saudi Arabia until the 1950's
Slovakia 6 Overvalued.
This should not have been on the list
Spain 15 Overvalued, the Spanish civil war was supposed to be taken into account
Maddison shows Spain as having a higher standard of living than Italy. That seems odd to me as well
Turkey 4 Very undervalued.
Turkey was a very poor country, with a standard of living about the same as India. While A&A games often give Turkey a large military force, its military was small for the size of the country and poorly equipped. In 1941, the Turkish government was desperately pleading for military equipment from the British
Yugoslavia 1 Very undervalued.
More extreme povertyI need to work some more with Maddison database. Perhaps averaging it with Correlates of War may get better results than either on their own.
-
I'm looking at both Maddison 2010 and Maddison 2018, and I see stuff changed a lot, not only in making India much more powerful.
I see that the 2018 Maddison greatly increased the estimated value of the Soviet Union, from the 2010 one.
In Maddison 2010 the 1937 GDP per capita of the USSR was 33.5% that of the USA, while in Maddison 2018 it is 41.2% (4307/10450).
For the USSR/Germany ratio, that is probably what matters the most in WW2, the change has been from 46.0% to 66.0%, for 1937.
So, the 2018 version has bumped the Soviet purchase power a lot, of a +23% when compared to the USA and +44% when compared to Germany.
So, using Maddison 2018 is going to give a much weaker Germany (and also a much weaker Italy) than using Maddison 2010.
Here I found an article that comments the changes, saying that, in Maddison 2018 "The USSR was also supposedly slightly richer than Italy, at the level of countries such as Austria and Finland, and only marginally behind the UK, France, and Germany as late as the early 1980s.".
http://www.unz.com/akarlin/latest-release-of-maddison-project-was-russia-richer-than-previously-thought/ -
Oil reserves (also other natural resources) should be only taken into account partially because oil rich countries won't gain too much when they capture these territories while other countries benefit them too much.
I mean for example capturing Sumatra will gain more to Japan rather than USA.
I've noticed also Romania is missing.
Turkey was weak but definitely deserves more Pus when Greece is 4 plus some natural resources like chromium.
Also how come Yugoslavia 1 while Croatia is 2?
Why there is huge gap between United Kingdom and France?
-
@Schulz said in How would you rate countries and territories considering realism in big WWII maps.:
Also how come Yugoslavia 1 while Croatia is 2?
Well spotted. Probably Croatia was not meant to be there.
Since it is GDP above subsistence, this could be possible if Yugoslavia outside Croatia had a GDP under the subsistence figure, but almost surely this is either a math error for at least one of the two or a huge discrepancy from interpolating or extrapolating.
-
Roughly Axis&Allies distribution will look something like this considerigthe year of 1942 which Axis at its peak.
Germany (All European Axis countries+occupied territories)= 275
Japan (All Asian Axis countries+occupied+territories)=67
Total=342British Empire=189
USSR=96
China=27
USA=246
Total=558Well in this kind of game we will have to implement either of them for playability.
-
Making USSR doomed to fall since Axis can only win in this scenario when USSR falls.
-
Making surviving certain rounds as Axis goal rtahter than winning.
-
Giving some handicaps to allies and bonuses to Axis.
-
-
@Cernel said in How would you rate countries and territories considering realism in big WWII maps.:
@Schulz said in How would you rate countries and territories considering realism in big WWII maps.:
Also how come Yugoslavia 1 while Croatia is 2?
Well spotted. Probably Croatia was not meant to be there.
Since it is GDP above subsistence, this could be possible if Yugoslavia outside Croatia had a GDP under the subsistence figure, but almost surely this is either a math error for at least one of the two or a huge discrepancy from interpolating or extrapolating.
This is another interpolation anomaly as the first figures for Croatia alone come later than 1950. It is surprising how most of the world in 1940's was no more than twice the level of subsistence.
And it is reasonable to view natural resources as being more important for a war effort than their share of the GDP alone would indicate. An industrial economy can compensate for the lack of natural resources in many ways, these compensation techniques have costs of their own.
Romania is barely above subsistence.
I wonder if Maddison is consistently underestimating the per capital GDP's of European countries.
-
@RogerCooper Does Maddison 2018 still use primarily and mostly year 1990 boundaries, despite the PPP being moved to 2011?
In particular, I'm looking at the figures for Ethiopia in Maddison 2010 and 2018. In Maddison 2010 there is "Eritrea and Ethiopia", but in Maddison 2018 there is only "Ethiopia", and there is no "Eritrea" anywhere. From 1950 to 1990 the population figure given in both databases is exactly the same, thus it has to be the same country. So, why is it called "Eritrea and Ethiopia" in Maddison 2010 but only "Ethiopia" in Maddison 2018, and which one of the two Maddisons has the wrong naming? Especially for the 1950 data, in either databases, is it actually Ethiopia only or is it comprising Eritrea too? Do the borders change at some year, like India?
The Maddison 2010 database available at the original Maddison website makes clear the 1950 and following figures for "Eritrea & Ethiopia" comprise Eritrea, so this has to be true for the "Ethiopia" of Maddison 2018, since the data are the same.
The only explanation that I can see, for the renaming, is that the name was changed from "Eritrea & Ethiopia" to just "Ethiopia" since "Eritrea" was internationally formally part of "Ethiopia" from 1950 to 1993, thus for 1990 if you say "Ethiopia" that includes "Eritrea" too. However, this seems incoherent to me with the fact that I'm seeing "Sudan (Former)", instead of just "Sudan". Since South Sudan was generally recognized in 2011, there are no reasons to say that, instead of just "Sudan", when using 1990 boundaries (and if that was done to be clear, then "Ethiopia" should have been called "Ethiopia (Former)" as well).
Or am I overlooking or misinterpreting something?
-
I've compiled myself a table from Maddison 2018 (integrated with my atlas for the 1937 South Africa population entry only), using all the countries given, except Angola, United Arab Emirates, Bahrain, Algeria, Kuwait, Qatar (so this would be all the world except those countries and the microstates not covered by Maddison 2018 (the only one sizeable country missing is actually Algeria)), and these are the results for all countries hitting the 1 permille figure of 1937 cGDP above a subsistence figure of 693.5 per person:
2.1 = Afghanistan
17.9 = Argentina
14.8 = Australia
4.1 = Austria
8.8 = Belgium
2.7 = Bulgaria
3.4 = Brazil
16.5 = Canada
5.2 = Switzerland
3.1 = Chile
32.3 = China (but the free China in mid 1942 would be only about 50% the population of China by 1937 shares)
1.9 = D.R. of the Congo
3.1 = Colombia
13.3 = Czechoslovakia
2.1 = Cuba
82.5 = Germany
5.2 = Denmark
4.1 = Egypt
15.1 = Spain
2.4 = Finland
43.1 = France
75.9 = United Kingdom
1.1 = Ghana
4.5 = Greece
2.8 = Hungary
12.7 = Indonesia
60.7 = India
2.0 = Ireland
3.8 = Iran
1.2 = Iraq
20.1 = Italy
35.6 = Japan
1.7 = Republic of Korea
2.2 = Morocco
4.8 = Mexico
1.4 = Myanmar
1.6 = Malaysia
3.6 = Nigeria
9.1 = Netherlands
3.2 = Norway
2.6 = New Zealand
1.3 = Peru
3.4 = Philippines
11.3 = Poland
1.3 = Puerto Rico
2.5 = Portugal
1.5 = Saudi Arabia
1.3 = Sudan (Former)
139.2 = Former USSR (but the free USSR in mid 1942 would be only about 60% the population of USSR by 1937 shares)
7.0 = Sweden
3.7 = Turkey
1.6 = Taiwan
1.5 = Uruguay
263.6 = United States
1.1 = Viet Nam
1.0 = Former Yugoslavia
7.3 = South Africa
Definitely you are virtually not seeing oil here, as Venezuela, that was the 3rd greatest oil producer (after USA and USSR, of course) doesn't even reach the 1 permille! Also Romania doesn't reach the 1 permille. However, these values should be fine for maps using fuel too (rather than abstracting oil production with PUs).
-
@Cernel I see some serious flaws in the Maddison figures. For example, Romania's per capita GDP jumps from 549 in 1947 to 1502 in 1948. I will try contacting the Maddison project for some comments.
Hello! It looks like you're interested in this conversation, but you don't have an account yet.
Getting fed up of having to scroll through the same posts each visit? When you register for an account, you'll always come back to exactly where you were before, and choose to be notified of new replies (either via email, or push notification). You'll also be able to save bookmarks and upvote posts to show your appreciation to other community members.
With your input, this post could be even better 💗
Register Login