Game Statistics Page
-
Hello everybody,
while looking at the Players and Resources tabs in the interface, I got the idea that it would be nice to have a graph of these figures over time.
So time on the x-Axis and things like TUVs, VCs, PUs, etc. on the y-Axis.And that got be thinking about a general statistics analysis page
I can imagine things like
- most contested territory
- biggest battle
- buys distribution per country
- destroyed units per country
- most effective convoy warfare
- strategical bombing overview
and probably many more.
What do you guys think about the idea in general?
I'd be willing to contribute to the implementation.
regards,
Simon
-
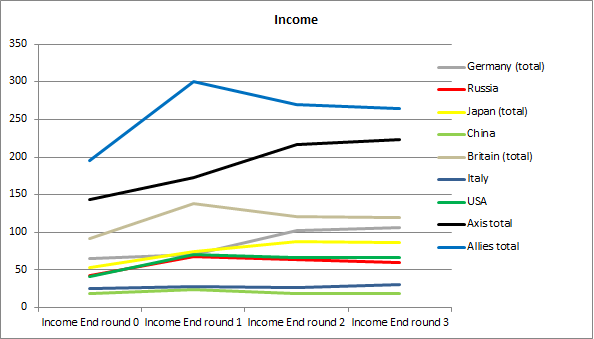
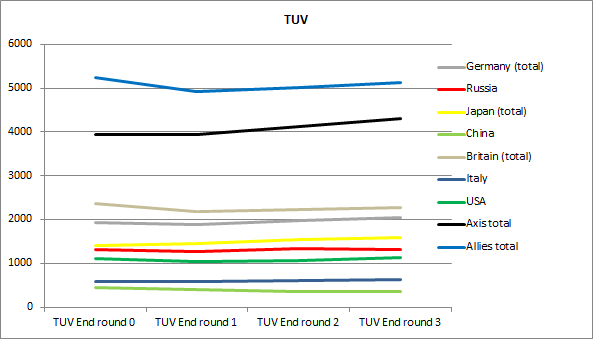
@lenzls Yep. This has been brought up a few times in the past. Some sort of probably popup display with graphs that shows by nation and by turn the TUV, production, resources, VCs, etc would be awesome.
Here is a manual spreadsheet example: https://www.axisandallies.org/forums/topic/32181/tww-2-8-0-5-redrum-vs-balladeer/83
-
The graphs look neat!
Do you by any chance have links to these old mentions?
I'm having a hard time searching for related threads.
regards
-
@lenzls The only one I have off the top of my head is this thread: https://forums.triplea-game.org/topic/474/total-game-report-option-for-statistical-purpose
That discusses some luck measures/tracking but also end turn/round reports and overall game statistics.
-
I played a bit around with the idea and have a first prototype running.
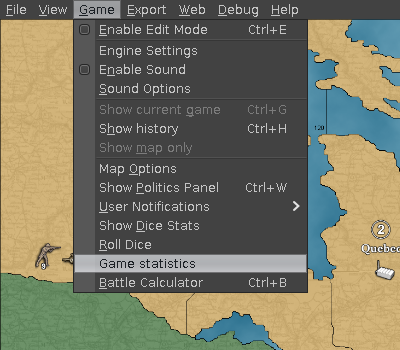
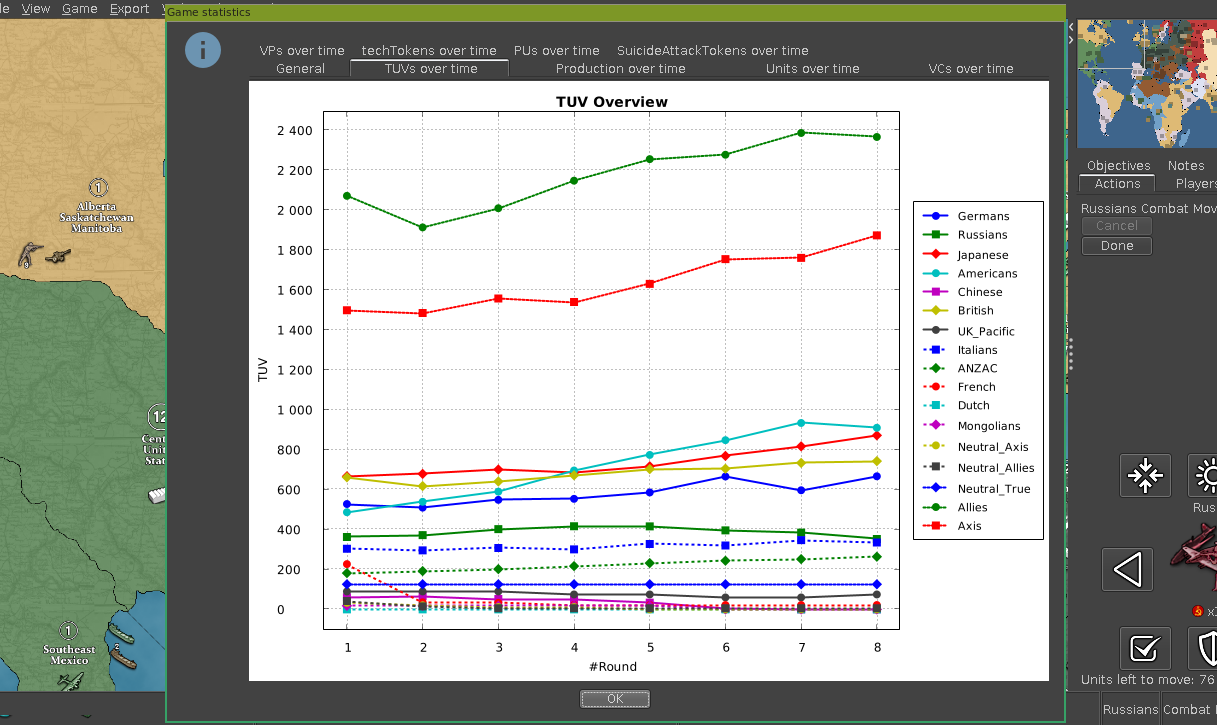
A menu item was added that opens a dialog window with various statistics. So far you can find there charts over time from the values of the
StatPanelon the right. So things like "TUV over time".I would like to know if you guys are looking for pull requests in that direction. Or if there are already requirements of you that I can incorporate.
My next step would be to implement more sophisticated metrics like the one from my first post ("most contested territory" for example).If you think this has future, I'd like to collaborate via a pull-request to also get some feedback on the code.
Under the hood I'm using XChart for plotting the charts and the
IStatimplementations for gathering of the values.Here are some screenshots:
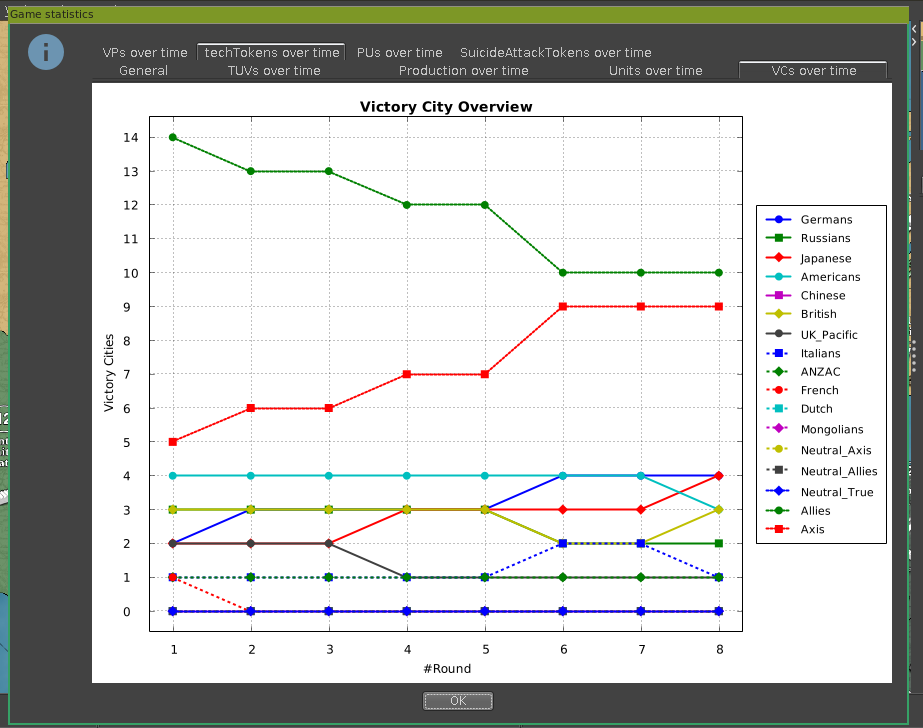
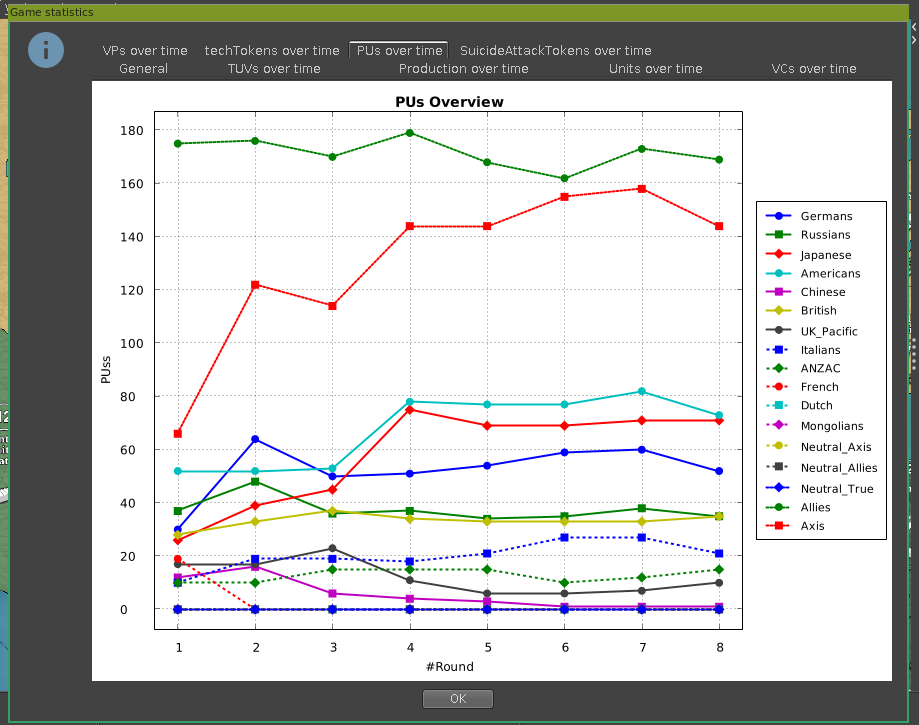
regards,
Simon
-
Looks pretty good, AFAIK this seems like a good direction. My only suggestion is to try and see if you can split up your updates into multiple PRs with around 250-500 lines per as there can also be a lot of detailed feedback around code design/testing.
I suspect a first step would be to add the menu item behind the 'beta feature flag' (see
ClientSettings.java) and probably then add dependencies and general framework and then the multiple tabs incrementally or as parallel PRs (likely at least 3-5 or more PRs)Some discussion perhaps would be good around which tabs maybe can be omitted. I'm not sure if there is a lot of value in 'SuicideAttackTokens', and perhaps 'over time' is redundant in the tab label displays.
Again, really cool to see the graphs for things like VC, and TUV, exciting to see that

-
That's very nice to hear!
I'll try my best with splitting up the work in sensible chunks for ease of reviewing.
@LaFayette said in Game Statistics Page:
Some discussion perhaps would be good around which tabs maybe can be omitted. I'm not sure if there is a lot of value in 'SuicideAttackTokens', and perhaps 'over time' is redundant in the tab label displays.
Your might be right about that. Reasoning was that the statistics shouldn't just work with the standard axis&allies maps, but also with other maps that maybe have more interesting resources. So I kept it generic and created a chart for all the dynamic resources (for G40 these are PUs, techTokens & SuicideAttackTokens) in the game.
An implementation question I'd like to discuss upfront:
I did not want to change the save-format or something, so I need to actually compute the statistics everytime you open the dialog anew. I would argue that this is even a good thing as it reduces complexity a lot.
But sadly performance suffers here. Currently it takes ~3-5 seconds to open the dialog. Imho with a loading spinner this would be tolerable for such a dialog that is not opened frequently. But I still like to improve.
I think the bottleneck is the rewinding of the history to the start of every round.for (Round round : rounds) { gameData.getHistory().gotoNode(round); doCalculations(); }Can you think of an alternative/faster route to get statistics from the past?
-
@lenzls You could cache the results and/or compute them in the background on game launch. Overall though, I'd stick to the rule of thumb: "working, clean, fast - in that order". I think we need to eventually have bigger updates to make game data broken up and store the history data as delta's and independent of the immutable data such as base game rules and map options. That would give many benefits, a compability for a custom save-game format that does not rely on serialization, smaller save games, and much faster game clone operations which cause many delays. Hence, IMO it might be okay to just cache the results and let it be somewhat slow until we can get those deeper changes in place. Grant it, if there is a way to cleanly make the rendering fast, then it would be very difficult to wait or object to that.