How would you rate countries and territories considering realism in big WWII maps.
-
We have to count foreign aids as domestis production (power) regardless of country and for example there is really nothing wrong in depicting Italy stronger than she was because Germany had deployed 15 divisons and hundred of planes, armours, trucks etc in North Africa.
-
@Schulz Any particular reasons why, in a map with Germans and Italians, you would want those German units and assets being represented by Italian production, units or assets, instead?
-
Because not counting German assets, supplies, helps etc... as Italian would make impossible to take Egypy for Axis since the Germans and Italians would be unable to attack together the British units. That does not really make sense.
I don't know did the Germans supply Italians in terms of resources? Sure they should all take into account as Italian domestic productions.
Also US lend lease should be represented as British-Soviet domestic productions.
-
@Schulz It is an over simplification to say that some measure of a countries wealth (eg. PU) gained by support from an Ally is inherently contained within the production of a territory without factoring that into the production value of the "parent" state(s). More over this idea assumes a constant, consistant and stable supply of resources or manpower every turn. Finally, what happens when the territory is lost? Does the enemy gain the bonus PU each turn? Is this to say the Germans would continue to send men and equipment to Southern Italy and simply hand it over to the Allies? Because if you add PU to Italian territories with this in mind... then theoretically that is what you are saying is happening.
"A joyous heart sours with the burden of expectation"
Hepster -
@Schulz If simply abstracting such things, I would rather suggest having triggers removing/adding income, under the condition of both capitals being free (or something), rather than screwing up actual production values. Italy had virtually no iron, no copper, no coal, no oil, etc. (like, France had over 20 times the iron extraction of Italy and Germany had almost 200 times the carbon production of Italy); so it had to import all from Germany controlled territories, but I don't know how much Italy paid back (also in terms of sending workforce (temporary emigrants) in the German mines, etc., that happened also before the war).
-
@Hepps said in How would you rate countries and territories considering realism in big WWII maps.:
@Schulz It is an over simplification to say that some measure of a countries wealth (eg. PU) gained by support from an Ally is inherently contained within the production of a territory without factoring that into the production value of the "parent" state(s). More over this idea assumes a constant, consistant and stable supply of resources or manpower every turn. Finally, what happens when the territory is lost? Does the enemy gain the bonus PU each turn? Is this to say the Germans would continue to send men and equipment to Southern Italy and simply hand it over to the Allies? Because if you add PU to Italian territories with this in mind... then theoretically that is what you are saying is happening.
If German helps should not be considered as Italian then this rule should be applied to Commonwealth nations too. Canadian and British troops should not be able to attack Germany together for example.
I think the best solution is calculating the exact German helps to the Italians then adding this extra Pus value to Northern Italy. (Or spreading all Italian territories) But if people want to make North African campaign more important then this extra values can be added to Tunisia. It would be also historical too.
-
Also I don't think capital cities would represent realism. Soviets wouldn't have collapsed without Moscow.
Making Rome as captal of Italy does not make sense. Northern Italy or Sicily would be better. But I would still prefer removing capitals in a realistic scenario.
-
I've found another methot to calculate the relatiive values of countries; Just want to share some countries. In this time I have taken into account resources and Indonesia emerged more valuable what do you think?
1939
USA: 370.352
Germany; 187.63
Slovakia: 4.67
Hungary: 31.24
Indonesia: 25.58 -
I'm so sad this thread is seems like abandoned.
-
@Schulz I have been cleaning up the new version of the Correlates of War database, which has some interesting data.
-
Would it be possible to rate realistic army positionings for may 1942?
-
@Schulz Check out this site West Point Military History Atlas
-
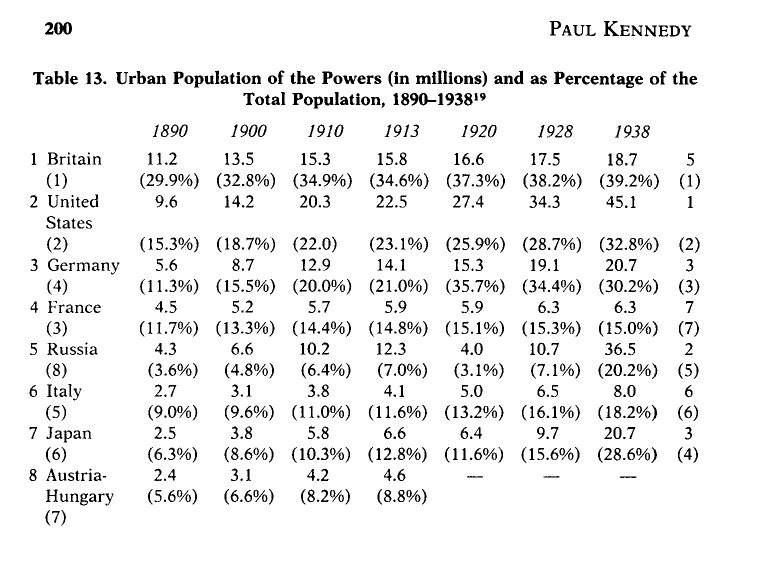
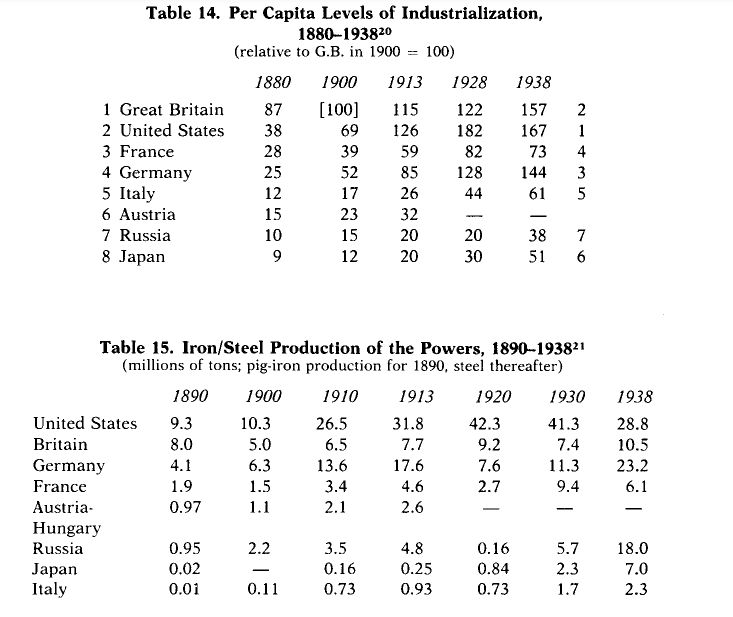
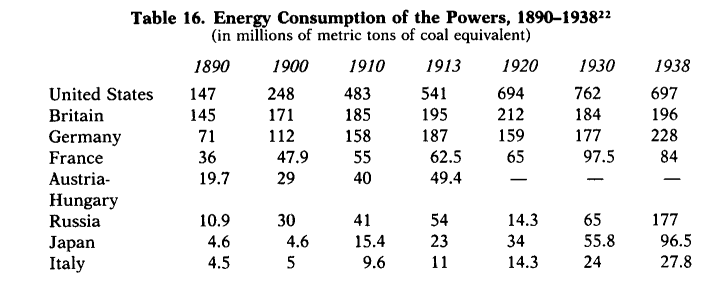
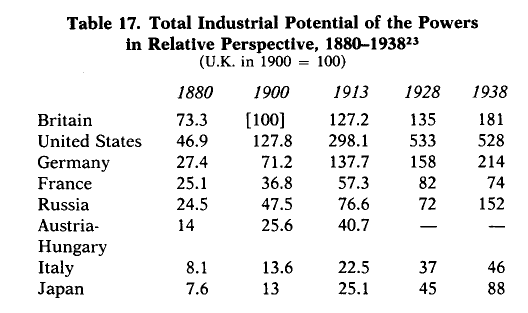
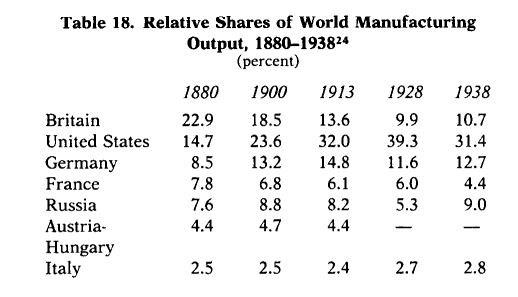
WW1 Datas but it has to be remembered that with a realistic 1914 scenario, Allies overall income shoul still be reduced not just because of balance purpose, because the stats do not show some CP advantages like being able to rapidly shift troops from one to another, isolated Russia with Ottomans entry into war, British naval/colonial expenses and American unpreparedness etc...
-
Interesting figures. I assume that Paul Kennedy was using the Correlates of War database.
It is worth noting that versions of Axis & Allies after the Anniversary edition have favored the Axis because the US's huge economy is nerfed.
-
No idea why do they always nerf the USA to too much. They could still make balanced games with USA nerfed more moderately.
-
@Schulz said in How would you rate countries and territories considering realism in big WWII maps.:
No idea why do they always nerf the USA to too much. They could still make balanced games with USA nerfed more moderately.
Overcompensating for the bias towards the Allies in Classic edition. In small map games, the problem is more a weak Russia than a weak USA.
-
I don't like having Russia significantly weaker than Japan either. But I do believe Germany should always be stronger than Russia even in pre-barbarossa borders and Germany should be 75% or 2 times stronger than Russia in 1942 set up.
-
@Schulz The East Front had on odd dynamic historically. German armies overperformed compared to their resources while the Russians underperformed. On the other hand, the German war production was inefficient compared to the Russians and Americans.
-
Germany had also overall more natural resources than the Soviets such as coal, iron ore and aluminium. The Lend Lease provided the Soviets opportunity to focus some specific areas, whereas German war production became very efficient after exerting total war economy in 1943 and 1944.
-
@Schulz According to John Ellis,Germany produced 12,063 tanks in 1943 and 19,002 tanks in 1944. An improvement from earlier in the war but still behind Russia with 24,089 & 28,963 respectively. The efficiency gap was still there.
Hello! It looks like you're interested in this conversation, but you don't have an account yet.
Getting fed up of having to scroll through the same posts each visit? When you register for an account, you'll always come back to exactly where you were before, and choose to be notified of new replies (either via email, or push notification). You'll also be able to save bookmarks and upvote posts to show your appreciation to other community members.
With your input, this post could be even better 💗
Register Login