Historical Statistics
-
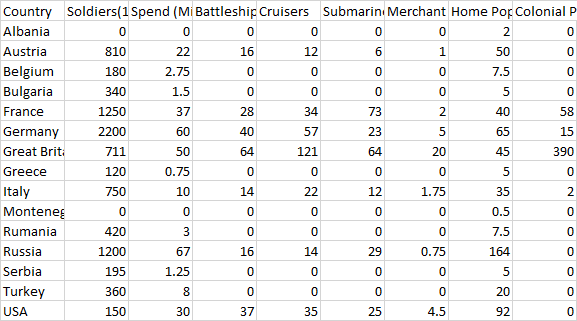
Those numbers probably give a good overall view and comparison. But I am sure most numbers don't match reality 100% when going into details. Denmark is a tiny nation, so it is not and has never been difficult to count men and material. Here are the above listed numbers compared to the numbers given by war museums in Denmark:
Denmark 2 0 8 12 65
Denmark 1 coastal defence cruiser (this was the largest ship type and had to siblings that were scrapped 1932 and 1936)
0 sub-destroyers
11 submarines
7 infantry (+8 thousand conscripts)
22 fighters (Fokker D. XXI (IIIJ) + a lot of biplane fighter-bombers that I wouldn't categorize as ww2 aircraft)Map maker of: Star Wars: Galactic War + Star Wars: Tatooine War + Caribbean Trade War + Dragon War + Age of Tribes + Star Trek: Dilithium War + Iron War + Iron War: Europe + Warcraft: War Heroes
-
@Frostion Yeah, with 2 battleships for Denmark, 4 battleships for Norway and 8 (!) battleships for Sweden that is more like Viking Age 2.
-
@Cernel Ellis gives 4,000 US aircraft in Dec 1941, so 2,500 seems reasonable for 1939.
-
@Frostion There are conceptual problems for any type of count. Consider for the US today, should you count the Reserves, the National Guard or the Coast Guard as being part of the military manpower? Do you include mothballed ships & aircraft?
-
Here is some figures from John Ellis, World War II, A Statistical Survey for Military Manpower at entry to the war.
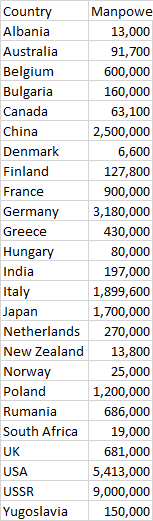 Country Manpower on Entry into War
Albania 13,000
Australia 91,700
Belgium 600,000
Bulgaria 160,000
Canada 63,100
China 2,500,000
Denmark 6,600
Finland 127,800
France 900,000
Germany 3,180,000
Greece 430,000
Hungary 80,000
India 197,000
Italy 1,899,600
Japan 1,700,000
Netherlands 270,000
New Zealand 13,800
Norway 25,000
Poland 1,200,000
Rumania 686,000
South Africa 19,000
UK 681,000
USA 5,413,000
USSR 9,000,000
Yugoslavia 150,000 -
Check this blog post by veteran wargame designer Frank Chadwick on the economic model for his game ETO.
-
@RogerCooper I've no idea what he means there with military manpower?
-
@RogerCooper Do you have figures about the various merchant marines in mid 1942? I have data for before the various countries joined the conflict (like 1940 or before), but not much thereafter.
I mean transports in general, summing merchant, supply, troopships, tankers, etc.. Not those that were being employed as merchant ones at the moment. Like the total tonnage of all transport ships, regardless of current commercial/military use (or absence thereof).
-
@Cernel Ellis's book covers starting numbers, casualties & production of merchant ships. I will work out some figures.
-
@RogerCooper Here are Merchant Marine figures derived from Ellis, with some extrapolation and assumptions. Figures are in 1,000's of tons. Note that there are no figures on German merchant losses and production, so I just extended the 1939 figure. Note that the US produced an incredible number of ships in 1943, 11,448,000 tons.
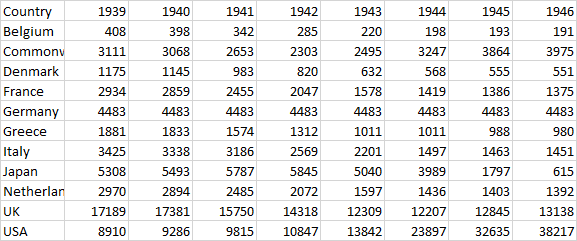 Country 1939 1940 1941 1942 1943 1944 1945 1946
Belgium 408 398 342 285 220 198 193 191
Commonwealth 3111 3068 2653 2303 2495 3247 3864 3975
Denmark 1175 1145 983 820 632 568 555 551
France 2934 2859 2455 2047 1578 1419 1386 1375
Germany 4483 4483 4483 4483 4483 4483 4483 4483
Greece 1881 1833 1574 1312 1011 1011 988 980
Italy 3425 3338 3186 2569 2201 1497 1463 1451
Japan 5308 5493 5787 5845 5040 3989 1797 615
Netherlands 2970 2894 2485 2072 1597 1436 1403 1392
UK 17189 17381 15750 14318 12309 12207 12845 13138
USA 8910 9286 9815 10847 13842 23897 32635 38217 -
@RogerCooper This may be a good reference, but I think there are some major problems with those data, that need to be addressed:
-
As there is only the year, are those the values at the start of the year? Measures of flux, like losses and production, would refer to a whole year, but measures of stock would be a point in that year. For example, to obtain the start 1943 stock of ships you would need to sum the 1942, but not the 1943, gains and losses.
-
It is not clarified what these "tons" are. Are they "gross register tons" (in this case, not actually weight, but volume), or something else, and, in this case, are they metric, British or US American (if any differences)? Are they all the same metre or just the figure for each country, in the tonnage metre used in that particular country? I also wonder if all the countries in the world, at that time, used to define tonnage the same way, or there were differences.
-
Do they include all ships, or some ships above some minimum tonnage, and how about ships locked in lakes that do not connect to the sea (mainly the Great Lakes merchant fleet of the USA)?
-
(as you say) The figure for Germany is simply the one of 1939 (I would rather leave the entries for the following years empty).
-
It is missing Norway (that, according to my data, was the 4th biggest merchant navy in the world, in 1939).
-
It doesn't specify if it does or doesn't include the losses from interned or captured ships or the gains from captured ships. In particular, the case of France, going through the armistice, the civil war, the undeclared war with the Allies (mostly Britain), the cessation of the armistice and the occupation of Free France, and the case of Italy, that lost a great quantity (about 1/3 of the total tonnage) of ships (interned), right after declaring war on France and Great Britain.
These are the 1939 only values, from an atlas originally printed in 1945:
Merchant Navies given in "tonnage", that I assume being what is now defined as "gross register tonnage", in cubic feets, tho I'm not sure about any of this, as it is not clarified. Also, it is not clarified if these are actually the values at the start of 1939.
Country Merchant Navy tonnage*, in 1,000 tons, in 1939 United Kingdom of Great Britain and Northern Ireland 17,984 United States of America 11,874 Japan 5,630 Norway 4,835 Germany 4,493 Italy 3,448 France 2,953 Low Countries 2,933 Greece 1,781 Sweden 1,582 Union of the Soviet Socialist Republics 1,316 Canada 1,305 Denmark 1,176 Spain 914 Panama 718 Finland 626 Belgium 408 Portugal 269 *including only ships of over 100 tons each
In the data above, there is not an entry for Commonwealth, that I assume it means the Dominions, and the only British Dominion present is Canada. So, I wonder about that Commonwealth figure, that is almost three times the one I have for Canada only (also wonder about how much of that is in the Great Lakes).
The only data that is over 10% away from your 1939 data is the one for the United States of America, that I've at 11,874, while you are giving at 8,910, I wonder if this may be because of not taking into account the Great Lakes fleet or maybe because of a different metre.
-
-
@Cernel In particular, at start 1942, the value for France should be split between the ones under Vichy control, the ones under Free French control (or are they counted as British?) and the ones interned (no idea how much impactful).
-
@Cernel The numbers are for the start of the year. My source, (Ellis, World War II, A Statistical Survey), does not specify anything else about the numbers.The omission of Norway was my error.
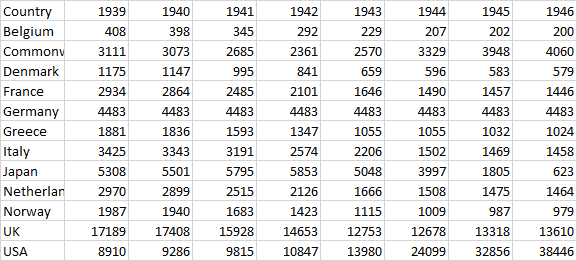 Country 1939 1940 1941 1942 1943 1944 1945 1946
Belgium 408 398 345 292 229 207 202 200
Commonwealth 3111 3073 2685 2361 2570 3329 3948 4060
Denmark 1175 1147 995 841 659 596 583 579
France 2934 2864 2485 2101 1646 1490 1457 1446
Germany 4483 4483 4483 4483 4483 4483 4483 4483
Greece 1881 1836 1593 1347 1055 1055 1032 1024
Italy 3425 3343 3191 2574 2206 1502 1469 1458
Japan 5308 5501 5795 5853 5048 3997 1805 623
Netherlands 2970 2899 2515 2126 1666 1508 1475 1464
Norway 1987 1940 1683 1423 1115 1009 987 979
UK 17189 17408 15928 14653 12753 12678 13318 13610
USA 8910 9286 9815 10847 13980 24099 32856 38446I have no figures on captured and interned ships. A loss of a third seems reasonable, but the overall effect is small compared to wartime production.
-
@RogerCooper Well, ok, 4,835 vs 1,987, that is less than half of the value I have, instead.
I found this article on the Norwegians:
https://pressto.amu.edu.pl/index.php/fsp/article/viewFile/3613/3645
In the summer of 1939 the Norwegian merchant fleet had 4 833 813 BRT[1] of tonnage and was classified in fourth place in the world, just after Britain, the United States and Japan (Steen 1959:111).
1. BRT (Brutto Register Tonne) it is a measure of vessel capacity counted in register tonnes. 1 registered tonne = 100 cubic feet = 2,83 m3.
So, I think, if that article is correct, either your data is wrong or there have to be something going on there, in the way it is measured?
Also, as I said, it is lame when a source (mine too) doesn't specifically exactly state what kind of tons or tonnage it is talking about. 1 gross ton in ww2 was 100 cubic feet, but a ton can also be a weight measurement for "displacement tons" and "deadweight tons" and, in this case, it can be either a British, an American or a metric ton.
As I said, I don't know how Ellis gets the figures, but Italy lost over 1 million tons of merchant ships in 1940, so that figure for start 1941 must be wrong by about 1 million. Also, no idea about how it calculates for after 1943, since, after the surrender, the Italian merchant marine was partly destroyed or captured by the Germans, and only a portion remained under Italian control (now co-belligerent with the United Nations).
So, that figure is some helpful, but it still has a number of question marks. Something more precise would be needed, for knowing exactly what were the merchant marines in 1942 or so.
-
-
-
@Cernel Ellis just lists the 1939 values and specifically invites the readers to extrapolate from the sinking & building figures.
For Italy, I simply calculated Italy as a member of the Allies in 1944 & 1945.
Ellis puts Axis shipping losses in the Med 187,000 for 1940.
-
Thought this group would find this post interesting, see link below:
-
Here are some more detailed manpower statistics from Ellis. Note that Japan does not fare badly in terms of total numbers:
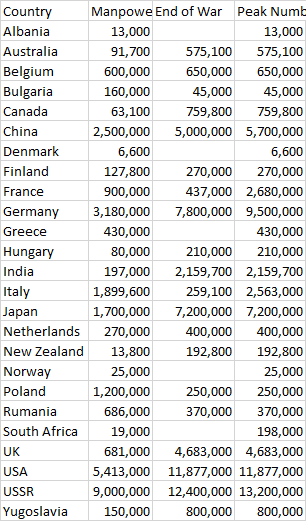 Country Manpower on Entry into War End of War Peak Number
Albania 13,000 13,000
Australia 91,700 575,100 575,100
Belgium 600,000 650,000 650,000
Bulgaria 160,000 45,000 45,000
Canada 63,100 759,800 759,800
China 2,500,000 5,000,000 5,700,000
Denmark 6,600 6,600
Finland 127,800 270,000 270,000
France 900,000 437,000 2,680,000
Germany 3,180,000 7,800,000 9,500,000
Greece 430,000 430,000
Hungary 80,000 210,000 210,000
India 197,000 2,159,700 2,159,700
Italy 1,899,600 259,100 2,563,000
Japan 1,700,000 7,200,000 7,200,000
Netherlands 270,000 400,000 400,000
New Zealand 13,800 192,800 192,800
Norway 25,000 25,000
Poland 1,200,000 250,000 250,000
Rumania 686,000 370,000 370,000
South Africa 19,000 198,000
UK 681,000 4,683,000 4,683,000
USA 5,413,000 11,877,000 11,877,000
USSR 9,000,000 12,400,000 13,200,000
Yugoslavia 150,000 800,000 800,000 -
I have added total mobilized:
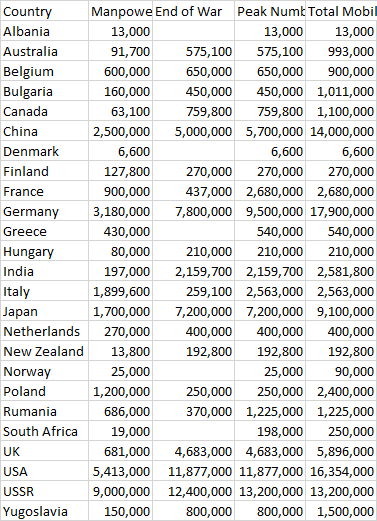 Country Manpower on Entry into War End of War Peak Number Total Mobilized
Albania 13,000 13,000 13,000
Australia 91,700 575,100 575,100 993,000
Belgium 600,000 650,000 650,000 900,000
Bulgaria 160,000 450,000 450,000 1,011,000
Canada 63,100 759,800 759,800 1,100,000
China 2,500,000 5,000,000 5,700,000 14,000,000
Denmark 6,600 6,600 6,600
Finland 127,800 270,000 270,000 270,000
France 900,000 437,000 2,680,000 2,680,000
Germany 3,180,000 7,800,000 9,500,000 17,900,000
Greece 430,000 540,000 540,000
Hungary 80,000 210,000 210,000 210,000
India 197,000 2,159,700 2,159,700 2,581,800
Italy 1,899,600 259,100 2,563,000 2,563,000
Japan 1,700,000 7,200,000 7,200,000 9,100,000
Netherlands 270,000 400,000 400,000 400,000
New Zealand 13,800 192,800 192,800 192,800
Norway 25,000 25,000 90,000
Poland 1,200,000 250,000 250,000 2,400,000
Rumania 686,000 370,000 1,225,000 1,225,000
South Africa 19,000 198,000 250,000
UK 681,000 4,683,000 4,683,000 5,896,000
USA 5,413,000 11,877,000 11,877,000 16,354,000
USSR 9,000,000 12,400,000 13,200,000 13,200,000
Yugoslavia 150,000 800,000 800,000 1,500,000
Hello! It looks like you're interested in this conversation, but you don't have an account yet.
Getting fed up of having to scroll through the same posts each visit? When you register for an account, you'll always come back to exactly where you were before, and choose to be notified of new replies (either via email, or push notification). You'll also be able to save bookmarks and upvote posts to show your appreciation to other community members.
With your input, this post could be even better 💗
Register Login